26. Moderation
In this lecture we aim to:
- Look at interactions between continuous predictors
- Introduce the PROCESS module
- Demonstrate in JASP
Reading: Chapter 10
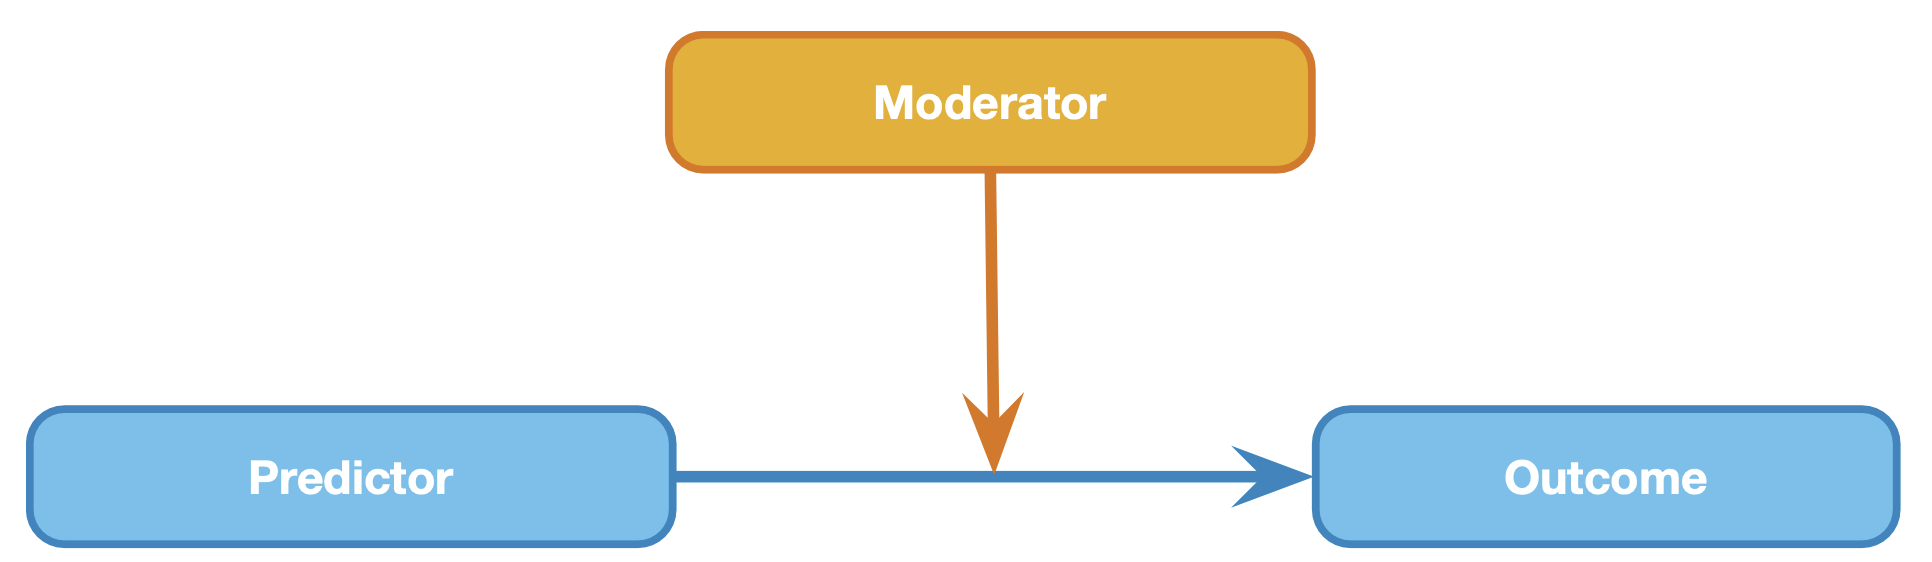
Moderation
Moderation
In statistics and regression analysis, moderation occurs when the relationship between two variables depends on a third variable. The third variable is referred to as the moderator variable or simply the moderator. The effect of a moderating variable is characterized statistically as an interaction.
Source WIKIPEDIA
Model
\(\definecolor{red}{RGB}{255,0,0} \definecolor{black}{RGB}{0,0,0} \color{black}Out_i = b_0 + b_1 Pred_i + b_2 Mod_i + \color{red}b_3 Pred_i \times Mod_i \color{black}+ \epsilon_i\)
Model
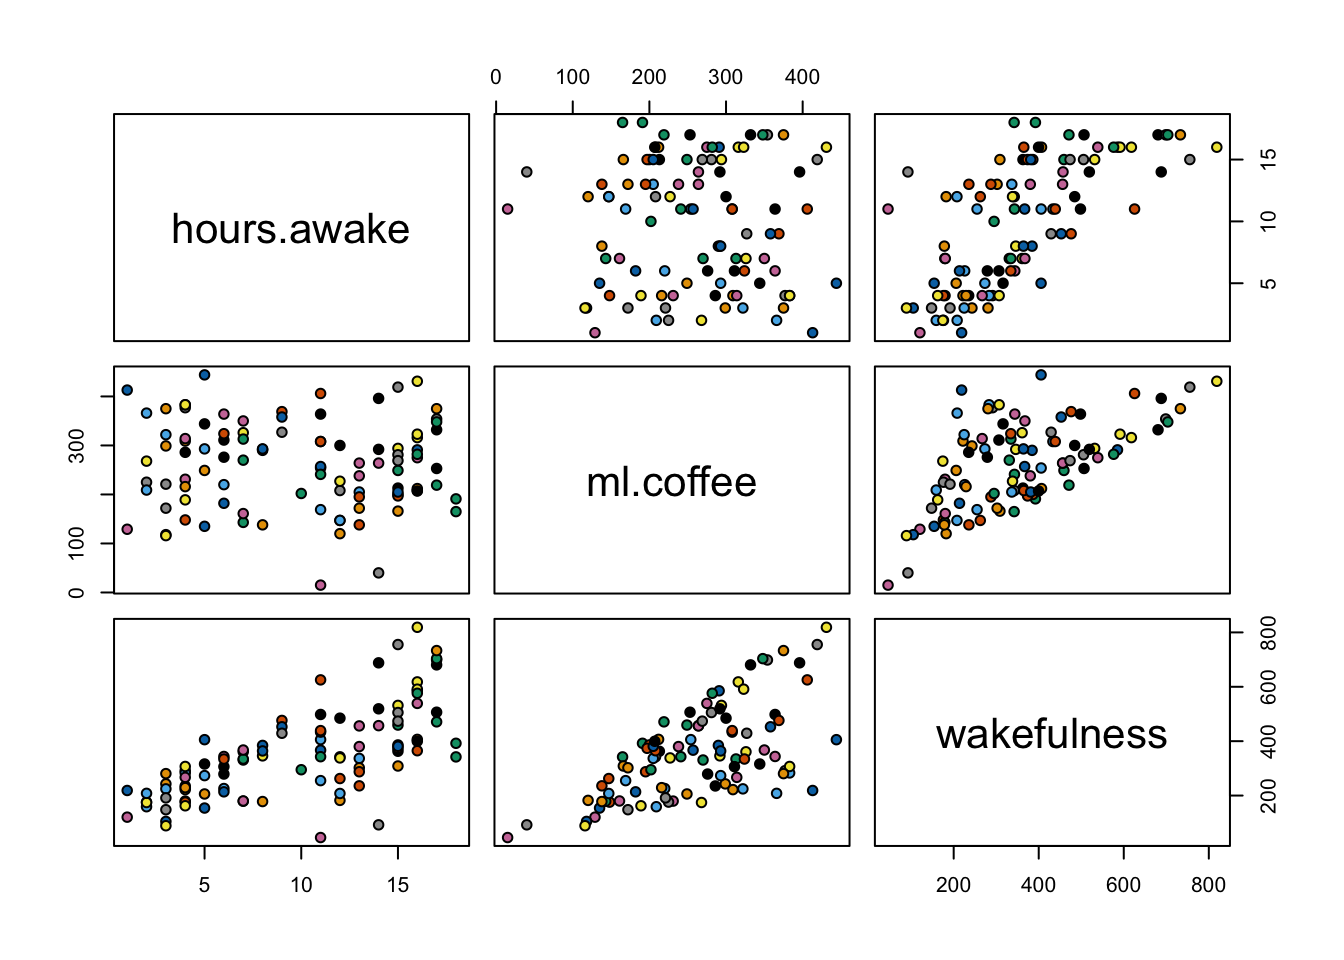
View data
Correlations
cor(data) hours.awake ml.coffee wakefulness
hours.awake 1.00000000 -0.05495344 0.6935652
ml.coffee -0.05495344 1.00000000 0.6175905
wakefulness 0.69356517 0.61759050 1.0000000Scatterplots
3D plot
Take it for a spin (does not work on tablet)
1 SD planes
sds       <- c(mean(ml.coffee)+(sd(ml.coffee)*c(-1,0,1)))
quantiles <- as.vector(quantile(ml.coffee,seq(.1,.9,.1)))
Fit model
fit <- lm(wakefulness ~ hours.awake + ml.coffee + hours.awake*ml.coffee); summary(fit)$coefficients Estimate Std. Error t value Pr(>|t|)
(Intercept) 61.6811406 12.103312777 5.096220 1.734165e-06
hours.awake -3.6114686 1.123014658 -3.215869 1.772655e-03
ml.coffee 0.2656703 0.042873015 6.196679 1.436438e-08
hours.awake:ml.coffee 0.1024285 0.004037068 25.371988 2.357675e-44Regression equation
\(\definecolor{red}{RGB}{255,0,0} \definecolor{black}{RGB}{0,0,0} \color{black}\widehat{Out_i} = b_0 + b_1 Pred_i + b_2 Mod_i + \color{red}b_3 Pred_i \times Mod_i \color{black}\)
\(\definecolor{red}{RGB}{255,0,0} \definecolor{black}{RGB}{0,0,0} \color{black}\widehat{Out_i} = 61.68 + -3.61 \times Pred_i + 0.27 \times Mod_i + \color{red} 0.1 \times Pred_i \times Mod_i \color{black}\)
\(\definecolor{red}{RGB}{255,0,0} \definecolor{black}{RGB}{0,0,0} \color{black}\widehat{Out_i} = 61.68 + -3.61 \times 15 + 0.27 \times 213 + \color{red} 0.1 \times 15 \times 213 \color{black} \approx 391.36\)
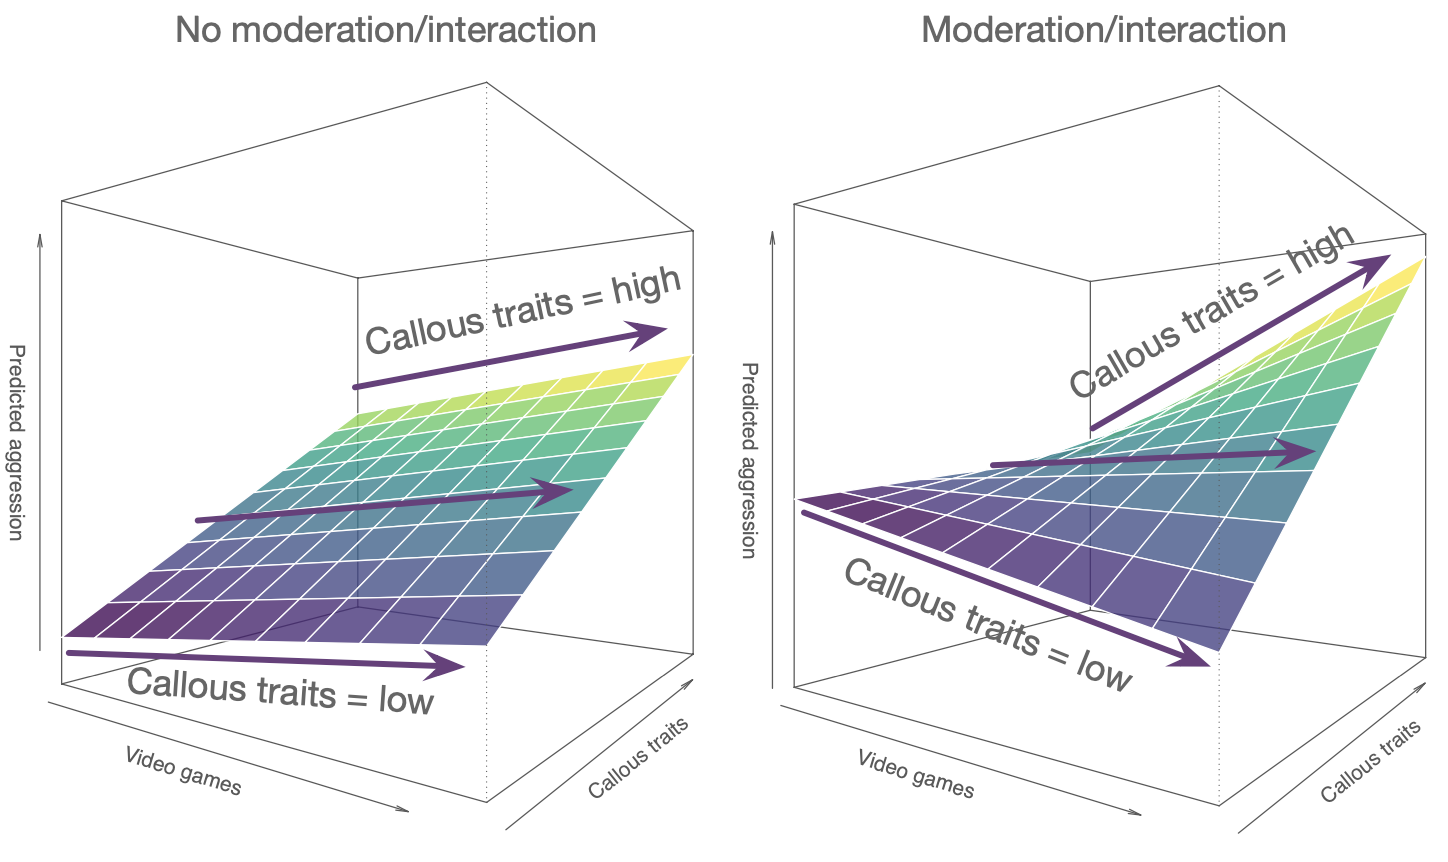
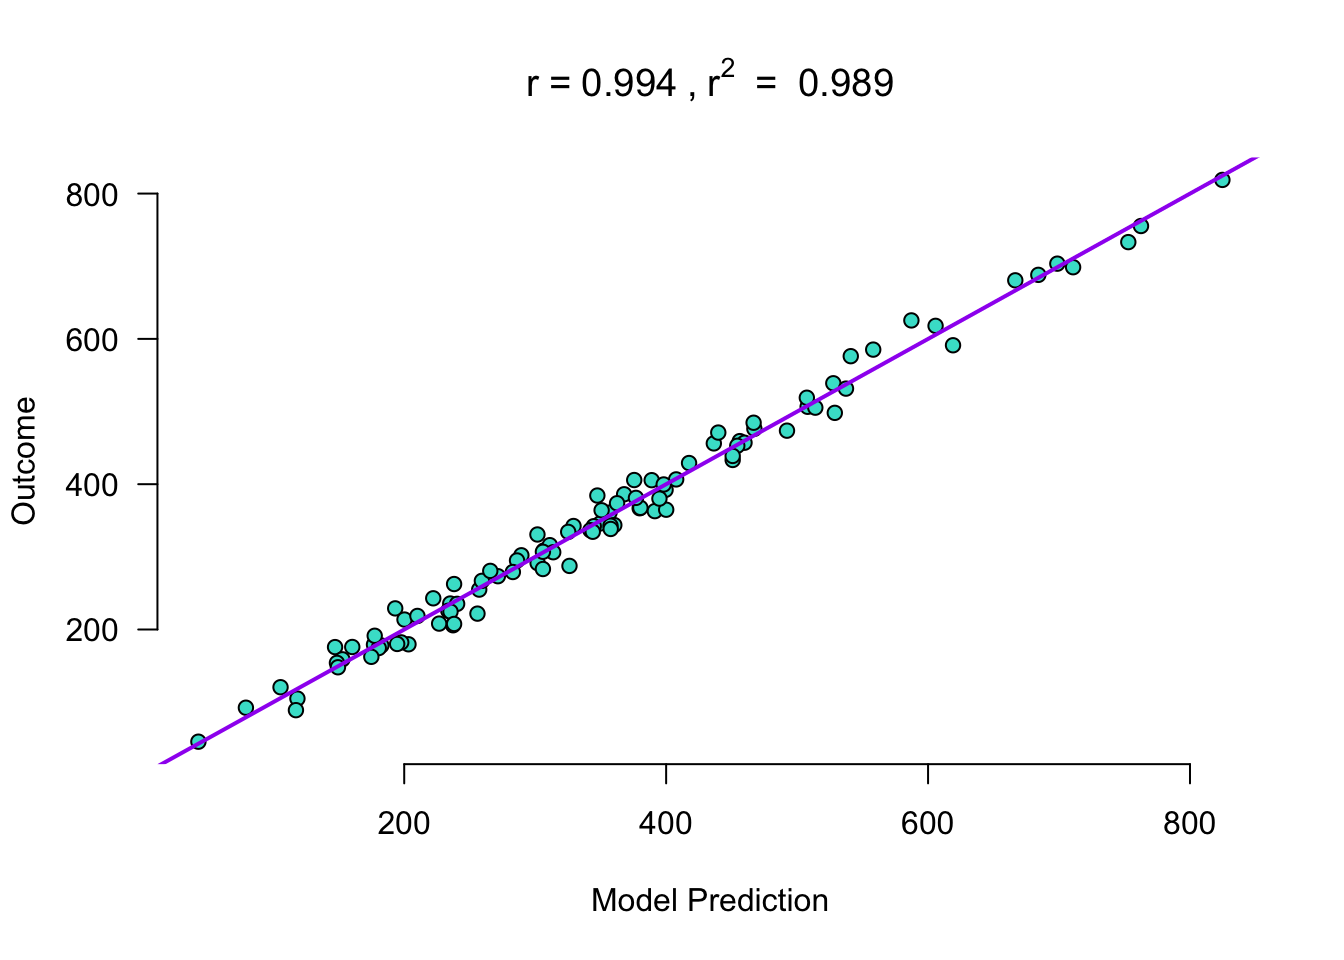
Expected surface
Expected values
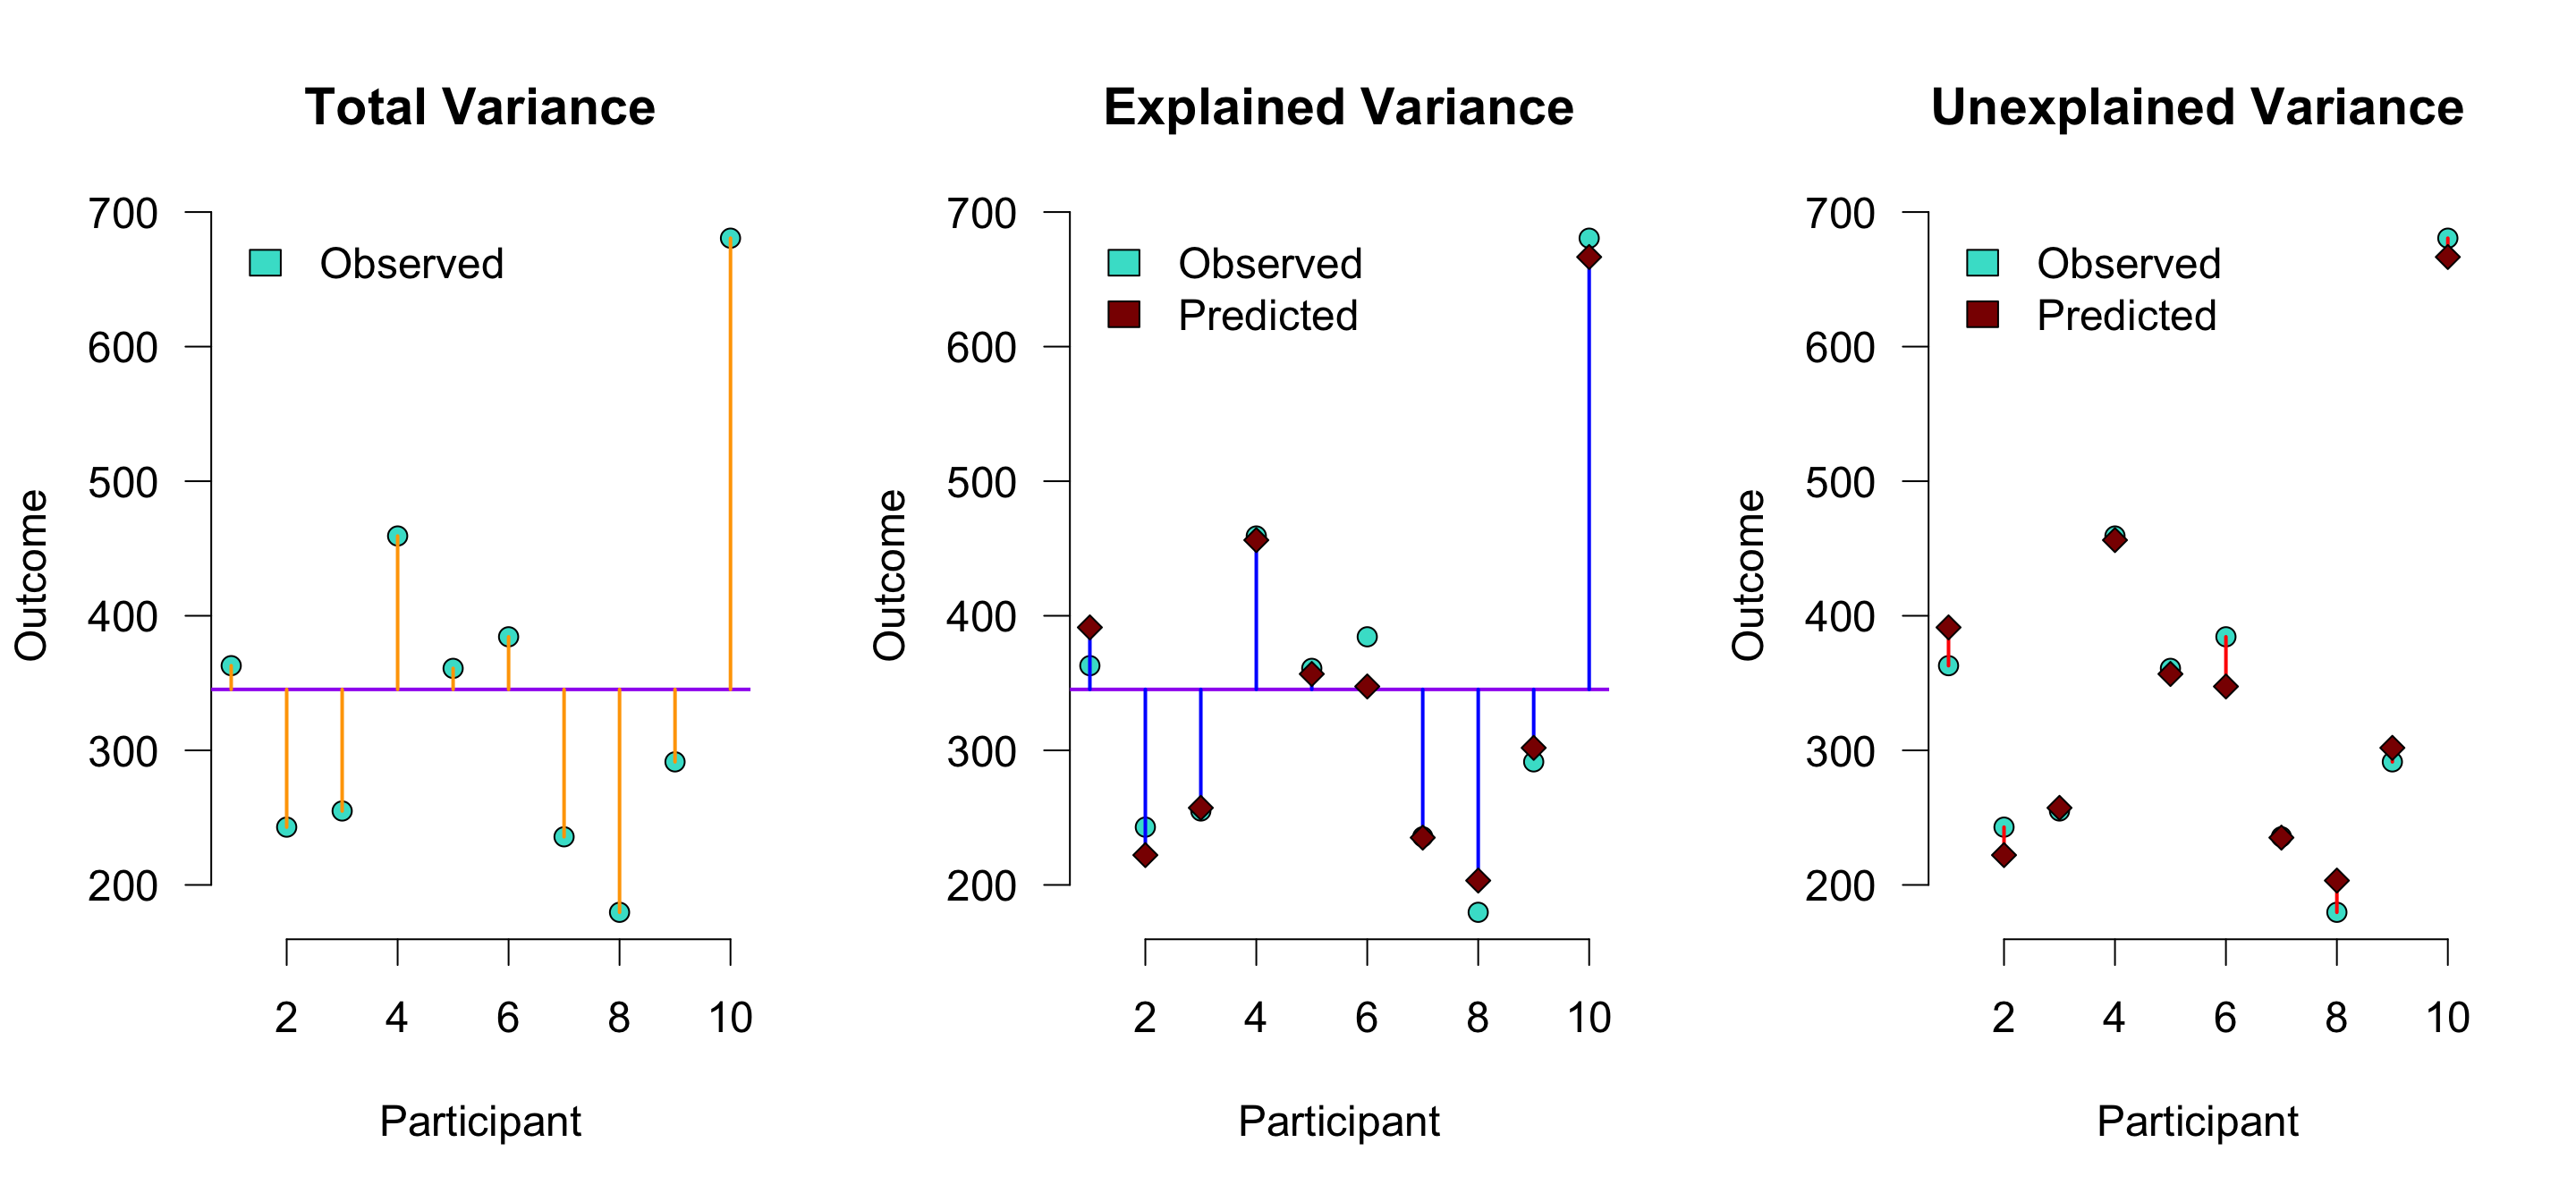
\(r^2\) is the proportion of blue to orange, while \(1 - r^2\) is the proportion of red to orange
Expected vs. observed
Turn quantitative into categorical?!
## Round to number of cups of coffee, always rounding down
data$cups.coffee <- data$ml.coffee %/% 150
Demonstration
- Moderation in Process module
- Moderation in regression module
- Equivalences in regression
![]()
Closing
Recap
- Interactions still matter with continuous predictors
- Continuous interactions can be assessed with:
- Linear regression
- PROCESS module
Recommended Exercises
Contact
