Two-Sided vs. One-Sided Testing
When we conduct a hypothesis test, we generally want to compare two hypotheses against each other. Each hypothesis makes a different statement about the parameter of interest. In order to illustrate how this works for testing a difference in means, we continue below with the example from the lecture about IQ differences for two conditions: Nootropics vs. Placebo. The null hypothesis is usually the same, stating that there is no group difference: \[\mathcal{H}_0: \text{difference} = 0\]
The alternative hypothesis can take on several forms: two-sided (A), one-sided negative (+), and one-sided positive (-):
\[\mathcal{H}_A: \text{difference} \neq 0\] \[\mathcal{H}_A+: \text{difference} > 0\] \[\mathcal{H}_A-: \text{difference} < 0\]
In order to compute the p-value that corresponds to the observed test-statistic, it matters what the alternative hypothesis postulates and how we define “difference”. In order to show this, we can do so for each of the three alternative hypotheses. Additionally, we can repeat this for two scenario’s:
- Scenario 1: we define the difference in means as  'Placebo' - 'Nootropics'
- Scenario 2: we define the difference in means as 'Nootropics' - 'Placebo'
Scenario 1: ‘Placebo’ - ‘Nootropics’
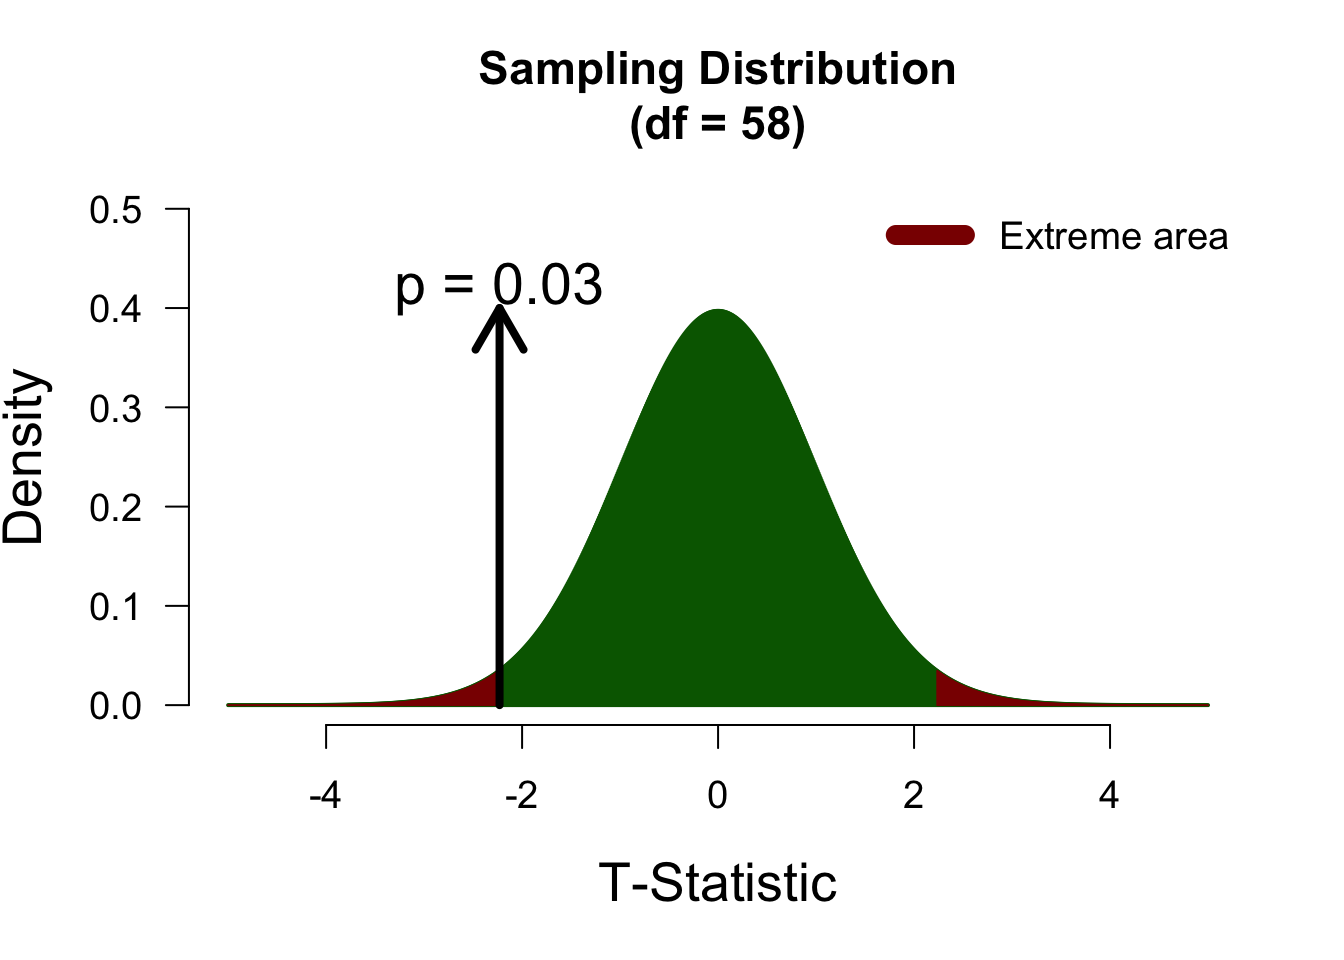
When our test statistic defines the group difference as ‘Placebo’ - ‘Nootropics’, a negative test statistic indicates that Nootropics scored higher. In the example, this was the case, and we observed a t-statistic of \(-2.23\). In each section below, the sampling distribution is plotted, including the observed t-statistic and its corresponding p-value: the probability of the data, or more extreme, if the null hypothesis is true. What constitutes “more extreme” depends on the alternative hypothesis - in the plots below, the extreme area is marked in darkred. In other words, the p-value equals the proportion of the distribution that is colored in darkred.
Two-sided test
In a two-sided test, t-values of 2 and -2 will yield identical p-values, since we consider both tails of the sampling distribution as “extreme”. Below, both tails are highlighted in darkred, to indicate that both are counted towards the p-value.
One-sided test (positive)
We now have an alternative hypothesis that only posits positive differences. We have defined difference as ‘Placebo’ - ‘Nootropics’, so this positive hypothesis is as follows: \[\mathcal{H}_{A+}: \mu_P - \mu_N > 0,\] which means that this hypothesis expects Nootropics to be lower than Placebo. Now, the right tail of the distribution is the extreme tail, so we look to the right of the observed t-value:
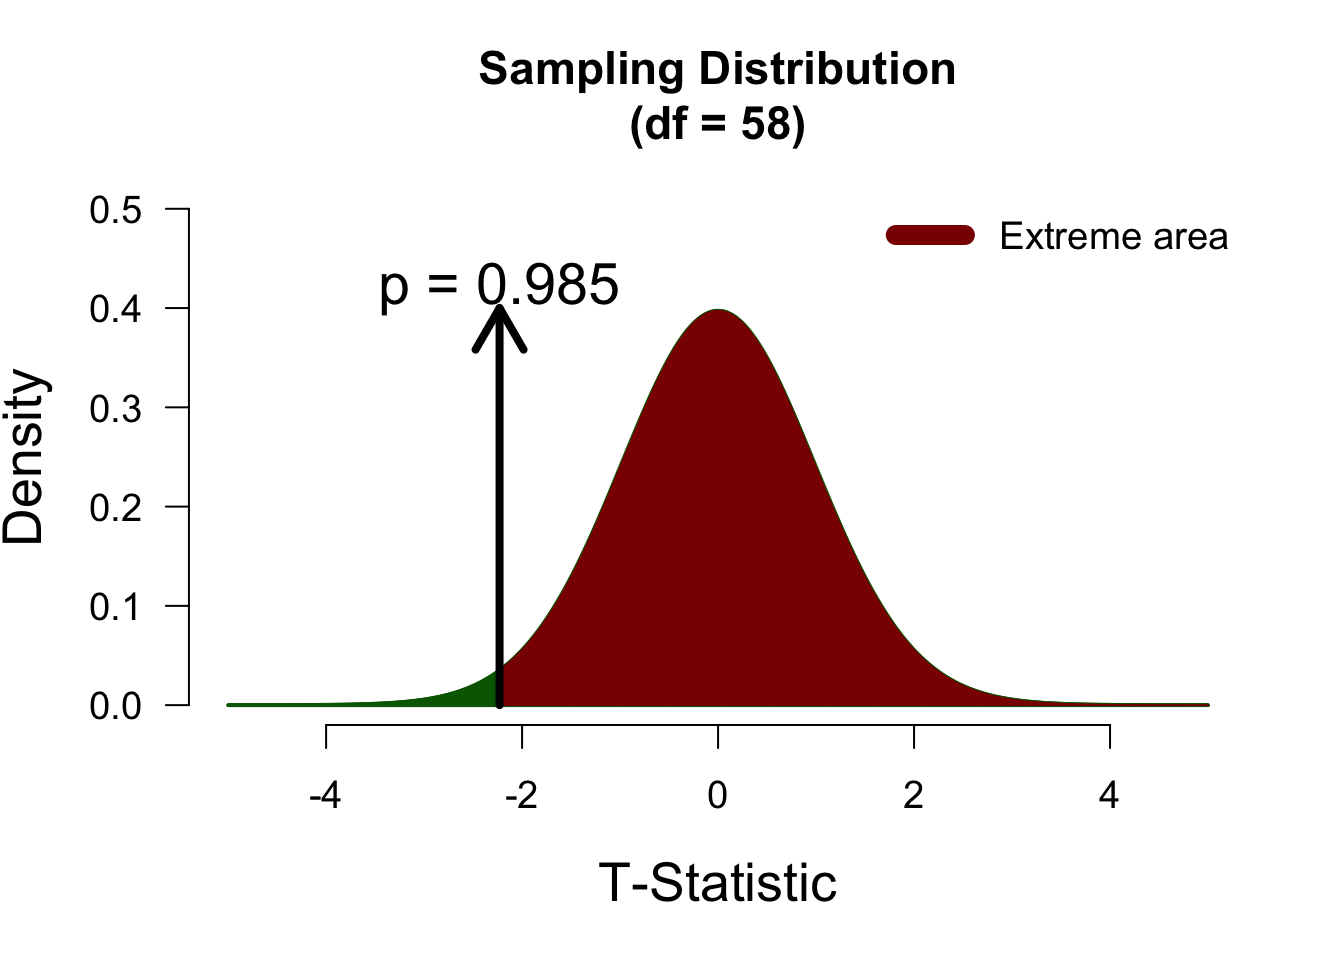
Since the observed t-statistic is in the opposite direction of what the alternative hypothesis predicts, the p-value is quite high (i.e., close to 1) and we fail to reject the null hypothesis.
One-sided test (negative)
We now have an alternative hypothesis that only posits negative differences. We have defined difference as ‘Placebo’ - ‘Nootropics’, so this negative hypothesis is as follows: \[\mathcal{H}_{A-}: \mu_P - \mu_N < 0,\] which means that this hypothesis expects Nootropics to be greater than Placebo. For the negative hypothesis, the left tail of the distribution is the extreme tail, so we look to the left of the observed t-value:

Since the observed t-statistic is in the same direction of what the alternative hypothesis predicts, the p-value is lower than its two-sided version, and we gather more evidence against the null hypothesis.
Scenario 2: ‘Nootropics’ - ‘Placebo’
When our test statistic defines the group difference as ‘Nootropics’ - ‘Placebo’, a positive test statistic now indicates that Nootropics scored higher. In the example, this was the case, and so the t-statistic is now \(2.23\). In each section below, the sampling distribution is plotted, including the observed t-statistic and its corresponding p-value.
Two-sided test
In a two-sided test, t-values of 2 and -2 will yield identical p-values, since we consider both tails of the sampling distribution as “extreme”. Below, both tails are highlighted in darkred, to indicate that both are counted towards the p-value.

One-sided test (positive)
We now have an alternative hypothesis that only posits positive differences. We have defined difference as ‘Nootropics’ - ‘Placebo’, so this positive hypothesis is as follows: \[\mathcal{H}_{A+}: \mu_N - \mu_P > 0,\] which means that this hypothesis expects Nootropics to be greater than Placebo. Now, the right tail of the distribution is the extreme tail, so we look to the right of the observed t-value:
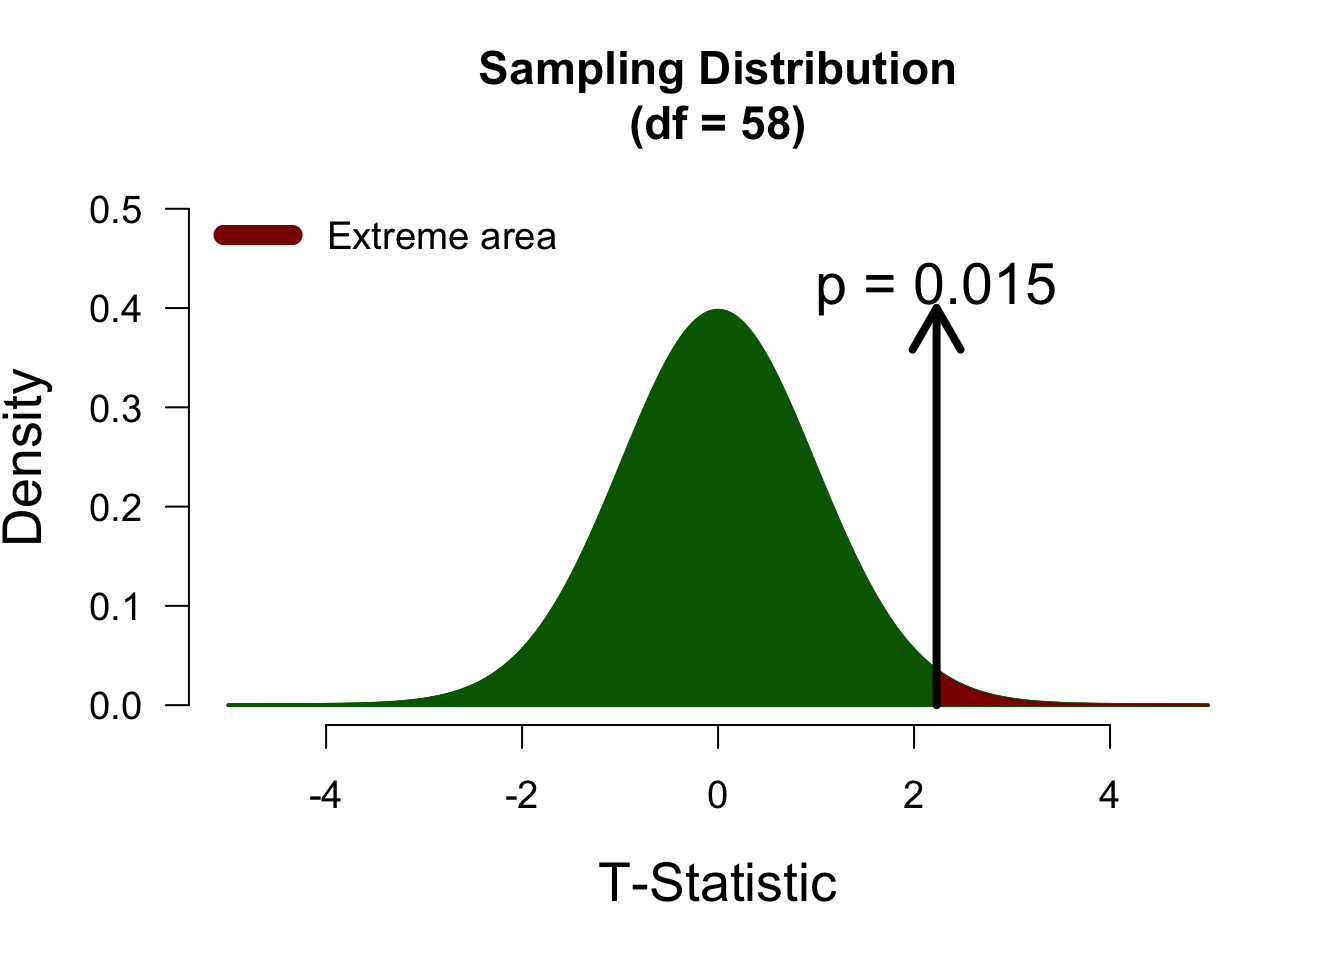
Since the observed t-statistic is in the same direction of what the alternative hypothesis predicts, the p-value is lower than its two-sided version, and we gather more evidence against the null hypothesis.
One-sided test (negative)
We now have an alternative hypothesis that only posits negative differences. We have defined difference as ‘Nootropics’ - ‘Placebo’, so this negative hypothesis is as follows: \[\mathcal{H}_{A-}: \mu_N - \mu_P < 0,\] which means that this hypothesis expects Nootropics to be smaller than Placebo. Now, the left tail of the distribution is the extreme tail, so we look to the left of the observed t-value:
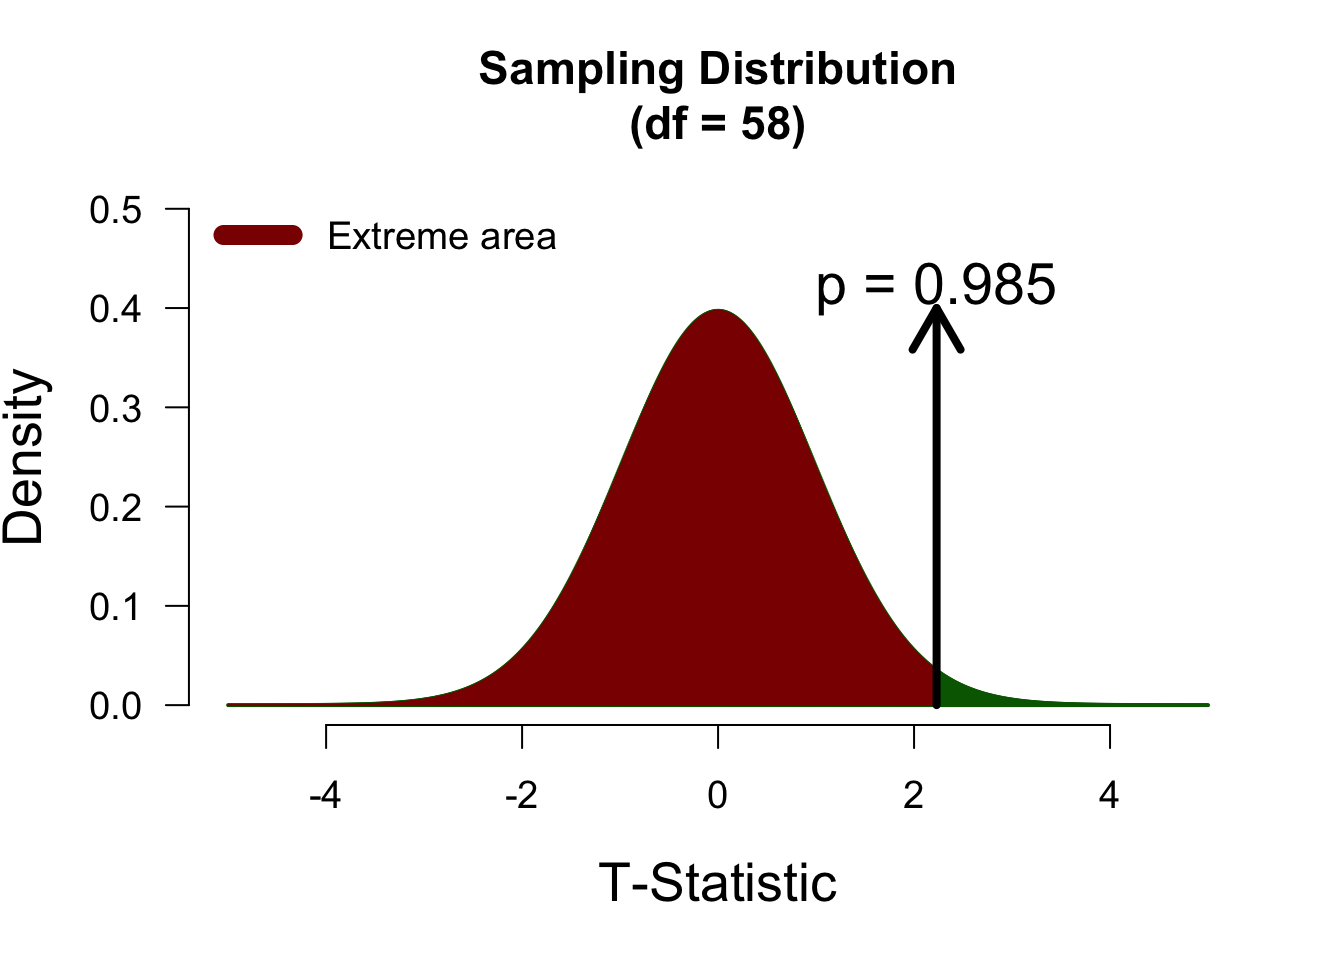
Since the observed t-statistic is in the opposite direction of what the alternative hypothesis predicts, the p-value is quite high (i.e., close to 1) and we fail to reject the null hypothesis.
Conclusion
When we test one-sided, we have to look at how we define the difference: group A - group B, or group B - group A? If the one-sided hypothesis predicts the right direction of the effect, it will yield more evidence against the null hypothesis than the two-sided test, but if it is incorrect about the direction of the effect, we usually do not have enough evidence to reject the null hypothesis. For the interactive version of these plots, you can take a look at the Shiny app.