18. RM ANOVA
Repeated & Mixed
In this lecture we aim to:
- Refresh some concepts from previous lectures
- Introduce RM ANOVA
- Introduce Mixed ANOVA
- Show these in JASP
Reading: Chapter 14 (§14.1–14.18)
ANOVA
One-way repeated
One-way repeated measures ANOVA
The one-way repeated measures ANOVA analyses the variance of the model while reducing the error by the within person variance.
- 1 dependent/outcome variable
- 1 independent/predictor variable
- 2 or more levels
- All with same subjects
Applet
Assumptions
- Continuous dependent variable
- Normally distributed
- Q-Q plots (or Shapiro-Wilk)
- Equality of variance of the within-group differences
- Mauchly’s test of Sphericity
- Same caution as Levene’s test (see also Misconception Mutt 14.1)
- Plus caution as with any p-value (black-and-white decision making)
- Greenhouse-Geisser correction is more robust
- See Field 14.5, table 14.2, Jane Superbrain boxes 14.2 and 14.3
- Always met when having only 2 levels
Formulas
| Variance | Sum of Squares | df | Mean Squares | F-ratio |
|---|---|---|---|---|
| Between | \({SS}_{{between}} = {SS}_{{total}} - {SS}_{{within}}\) | \({df}_{{total}}-{df}_{{within}}\) | \(\frac{{SS}_{{between}}}{{df}_{{between}}}\) | |
| Within | \({SS}_{{within}} = \sum{s_i^2(n_i-1)}\) | \((n_i-1)n\) | \(\frac{{SS}_{{within}}}{{df}_{{within}}}\) | |
| • Model | \({SS}_{{model}} = \sum{n_k(\bar{X}_k-\bar{X})^2}\) | \(k-1\) | \(\frac{{SS}_{{model}}}{{df}_{{model}}}\) | \(\frac{{MS}_{{model}}}{{MS}_{{residual}}}\) |
| • Residual | \({SS}_{{residual}} = {SS}_{{within}} - {SS}_{{model}}\) | \((n-1)(k-1)\) | \(\frac{{SS}_{{residual}}}{{df}_{{residual}}}\) | |
| Total | \({SS}_{{total}} = s_{grand}^2(N-1)\) | \(N-1\) | \(\frac{{SS}_{{total}}}{{df}_{{total}}}\) |
Where \(n_i\) is the number of observations per person and \(k\) is the number of conditions. These two are equal for a one-way repeated ANOVA. Furthermore \(n\) is the number of subjects per condition and \(N\) is the total number of data points \(n \times k\).
Example
Measure driving ability in a driving simulator. Test in three consecutive conditions where participants come back to attend the next condition.
- Alcohol none
- Alcohol some
- Alcohol much
- \(\alpha = 0.005\)
The data
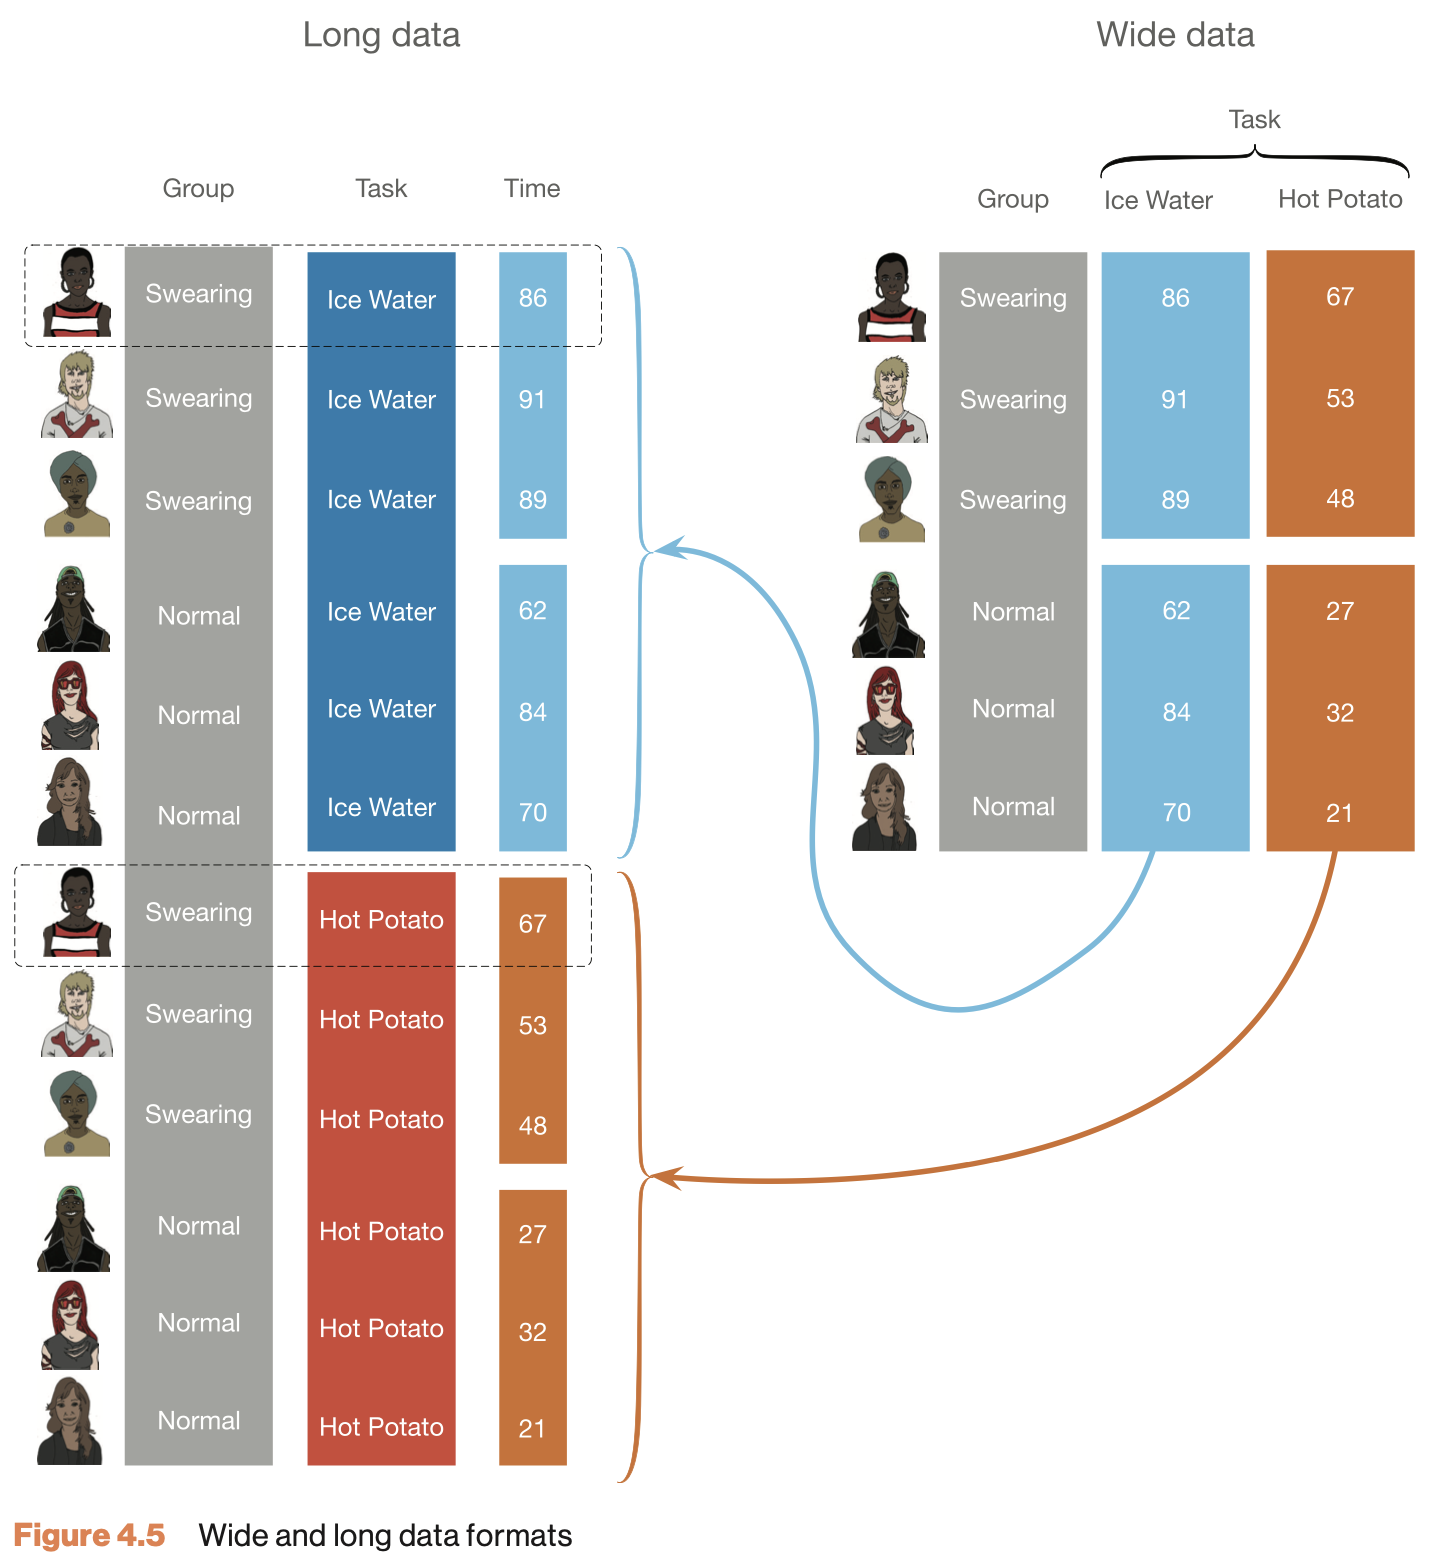
Wide vs. long data formats
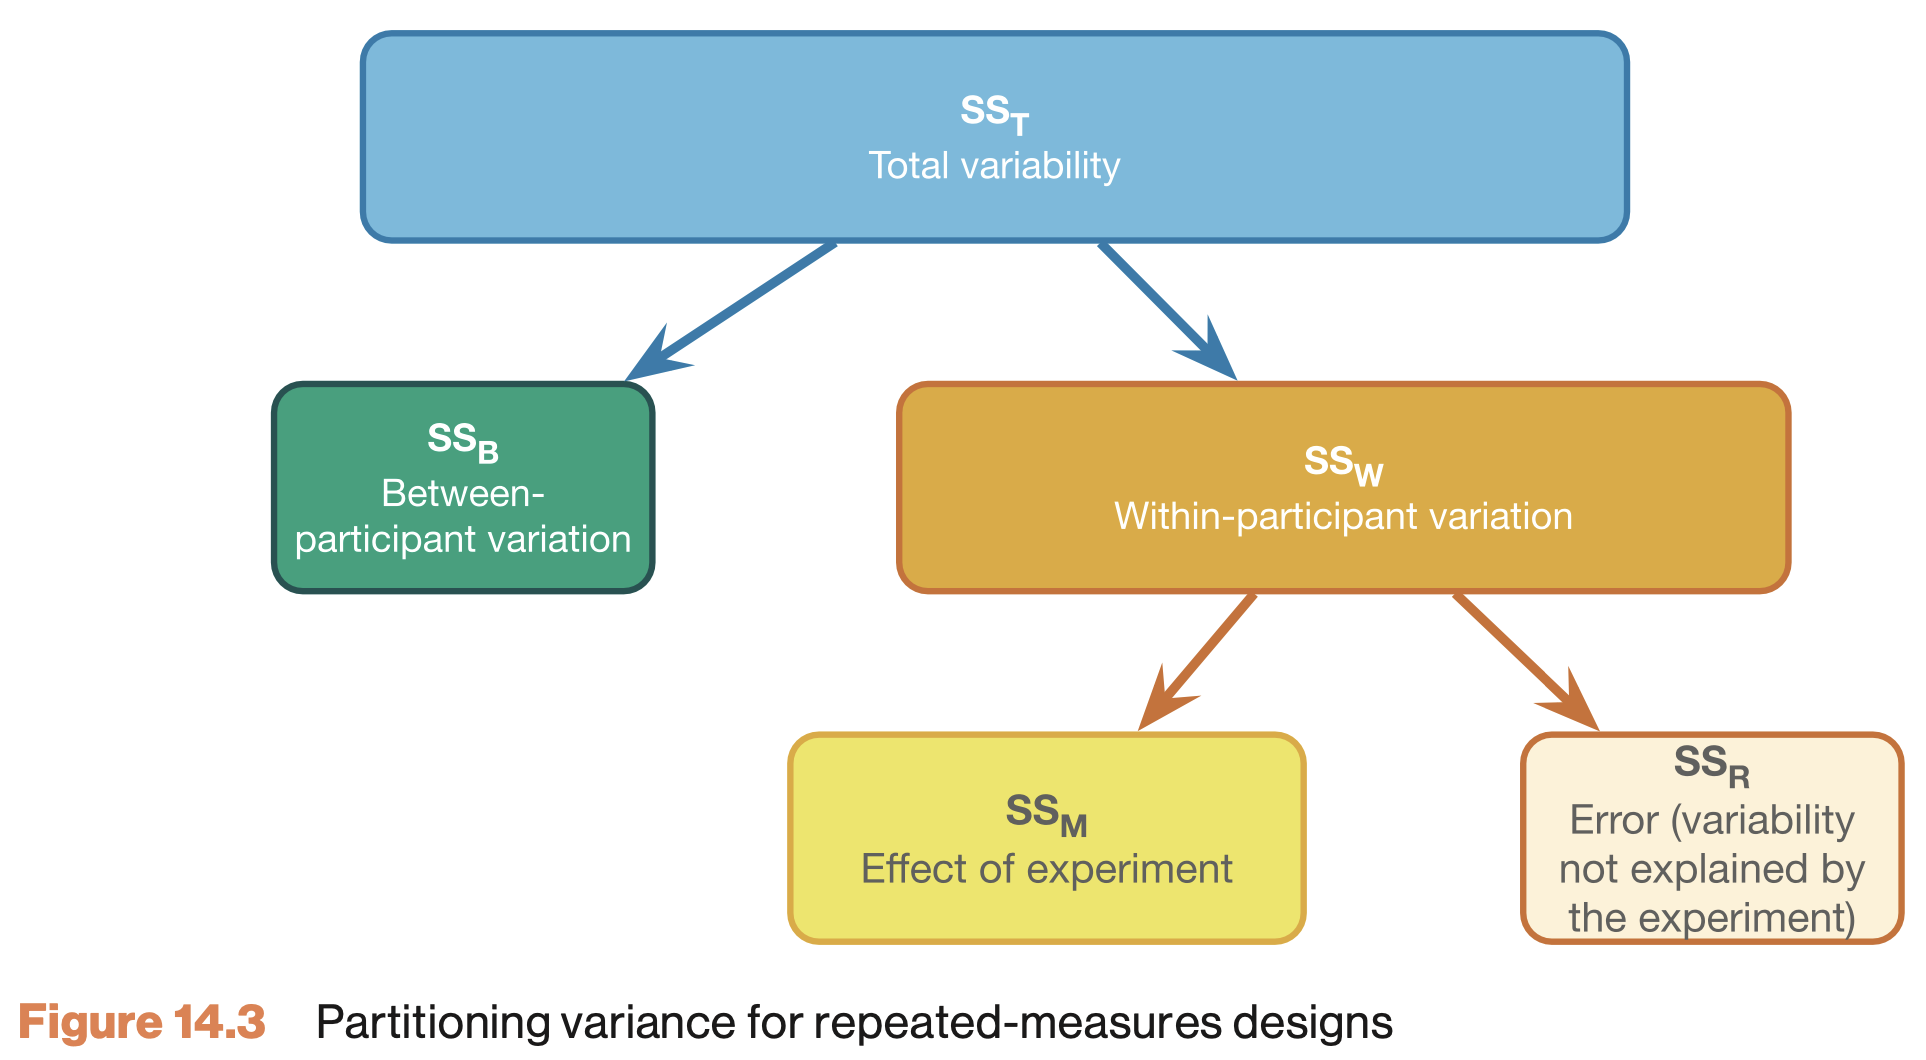
General flow RM ANOVA
- We look at total variance
- We divide it:
- Within subject variance
- Between subject variance
How much of the within subject variance can we explain by looking at alcohol condition?
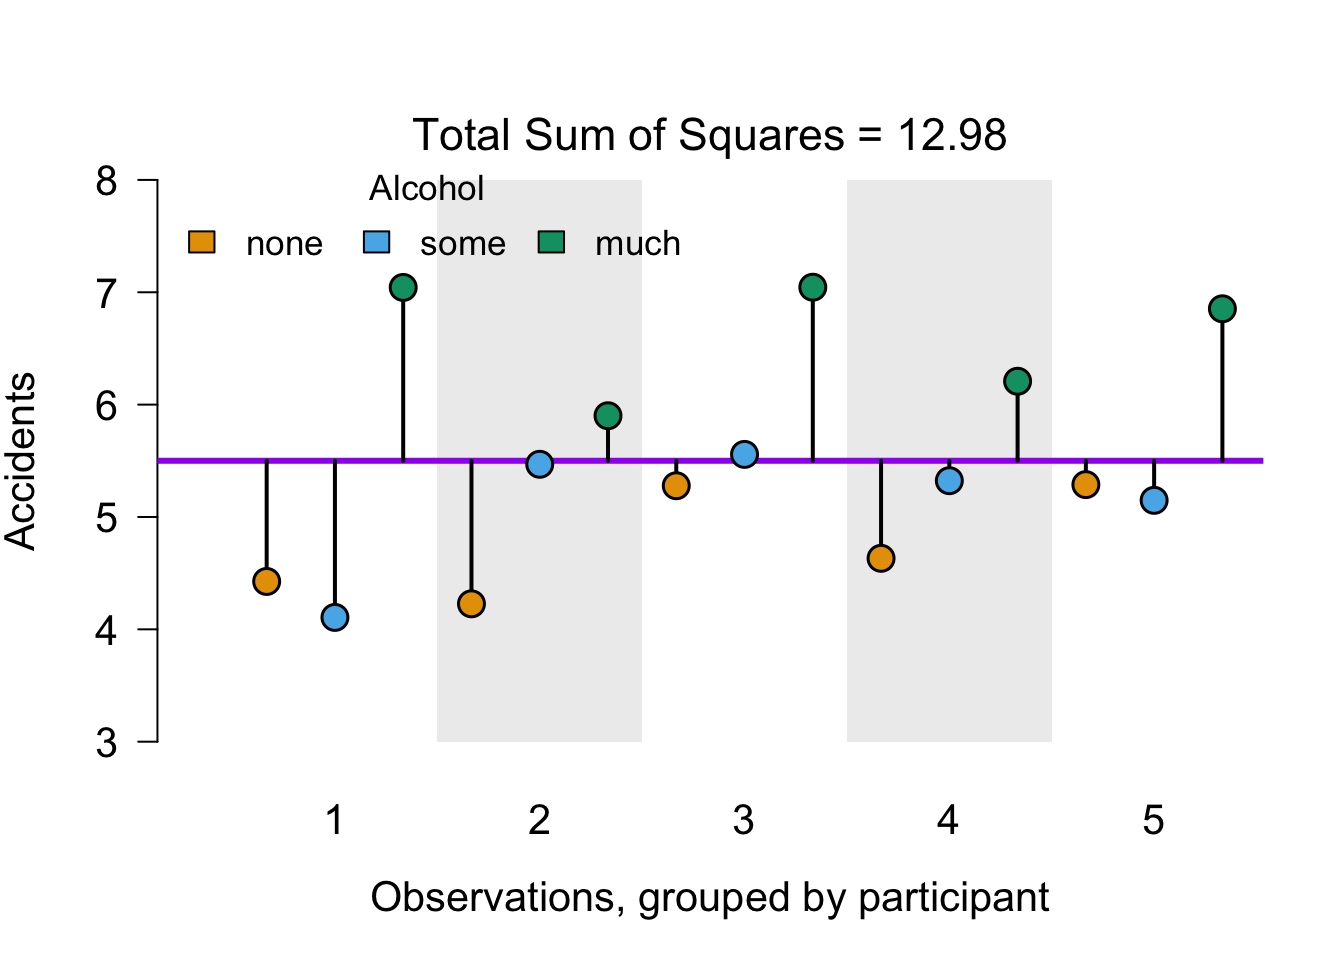
Total variance (SS total) - visual
Within subject variance (\(SS_{within}\))
\({SS}_{{within}} = \sum{s_i^2(n_i-1)}\)
[1] 11.54771Within subject variance (\(SS_{within}\)) - visual
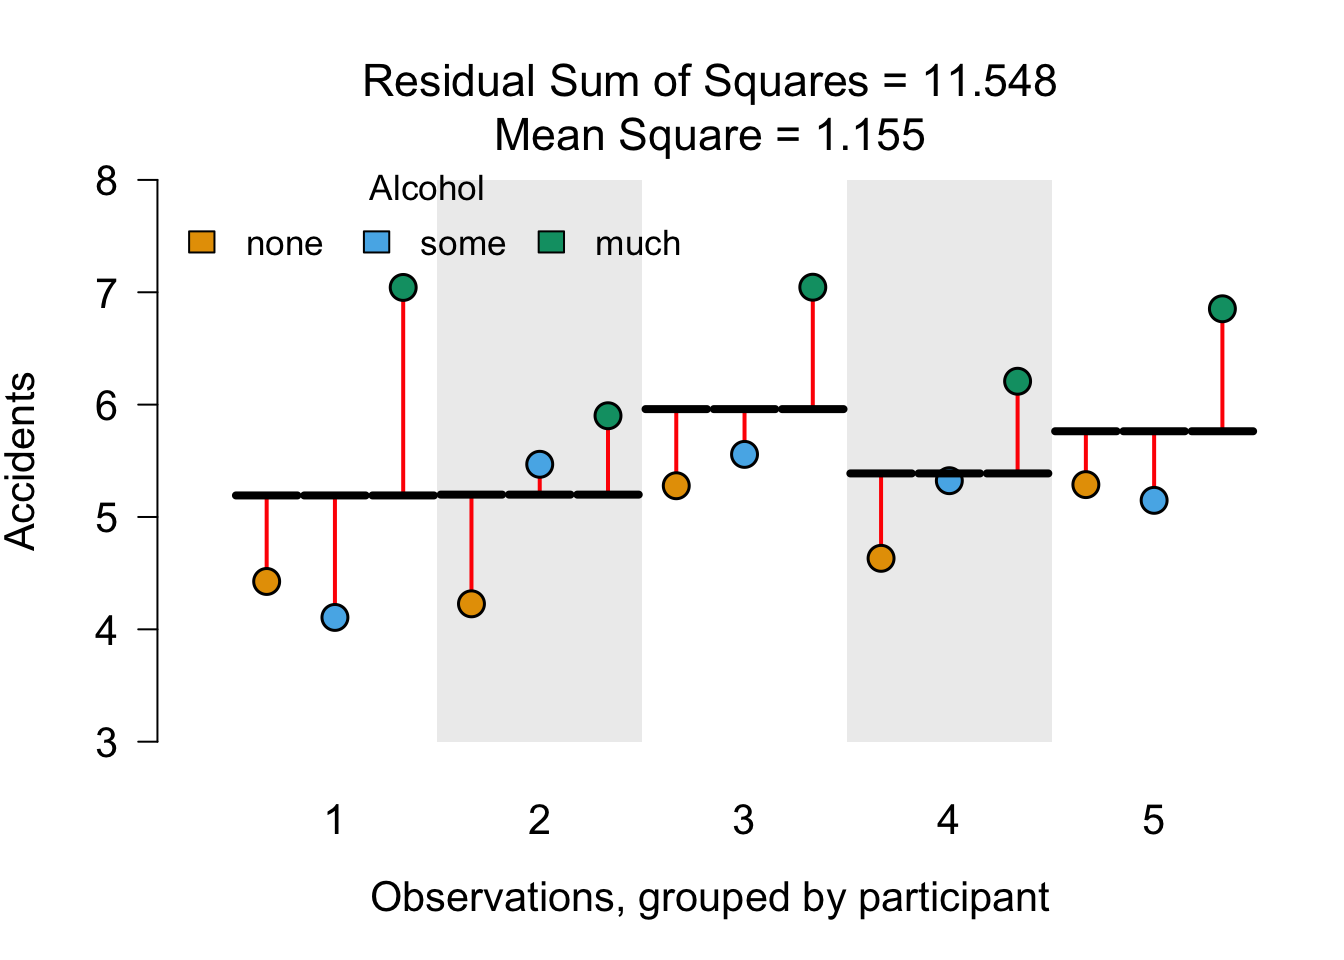
Within subject variance (\(SS_{within}\)) - data
Alcohol model SS (\(SS_{model}\))
\({SS}_{model} = \sum{n_k(\bar{X}_k-\bar{X})^2}\)
[1] 9.543261Alcohol model SS visual
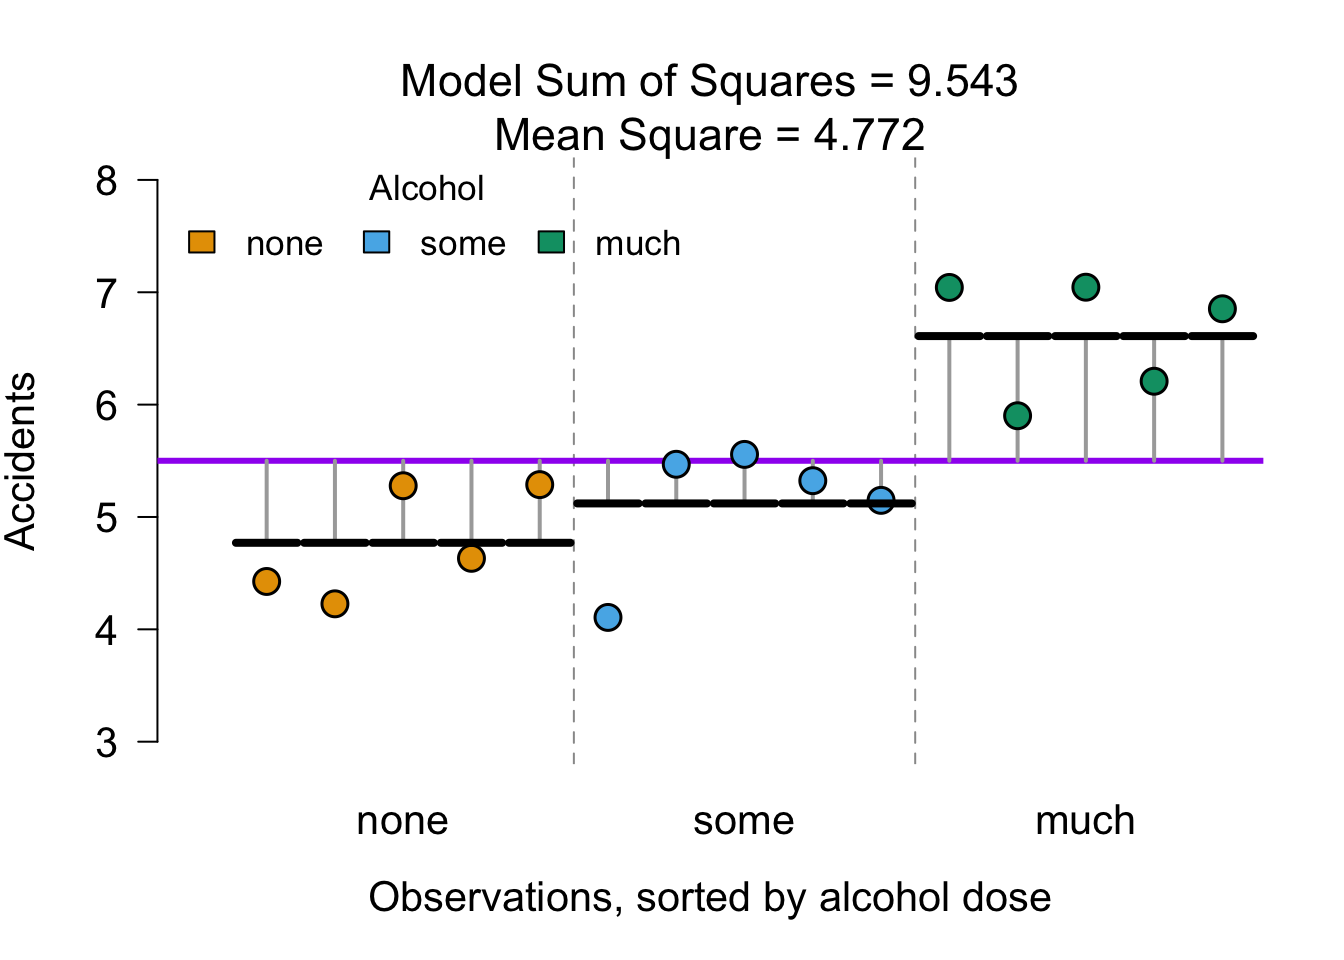
Full model SS visual
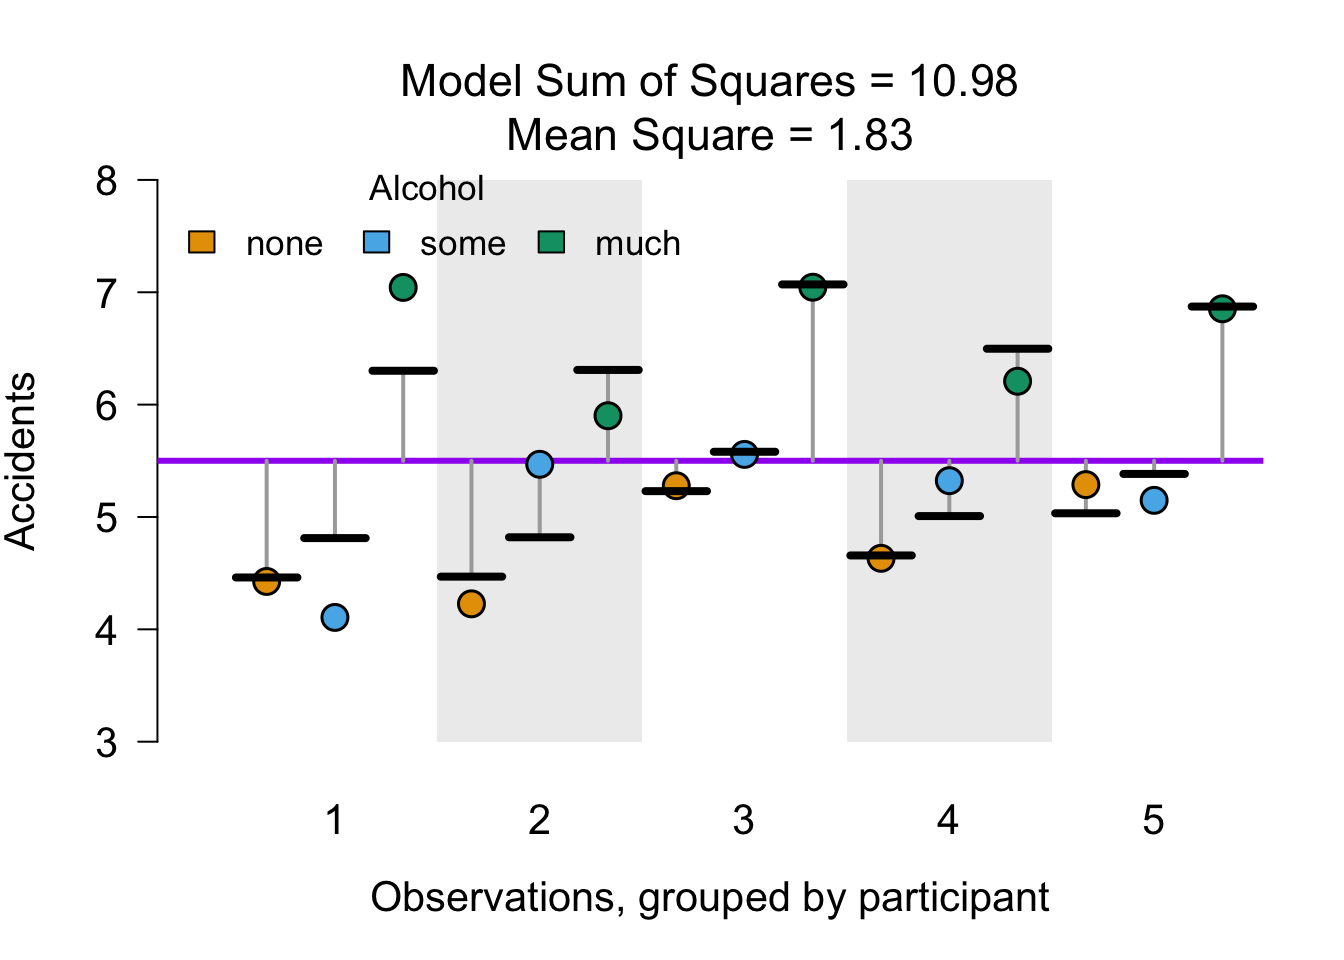
Full model residual SS visual (\(SS_{residual}\))
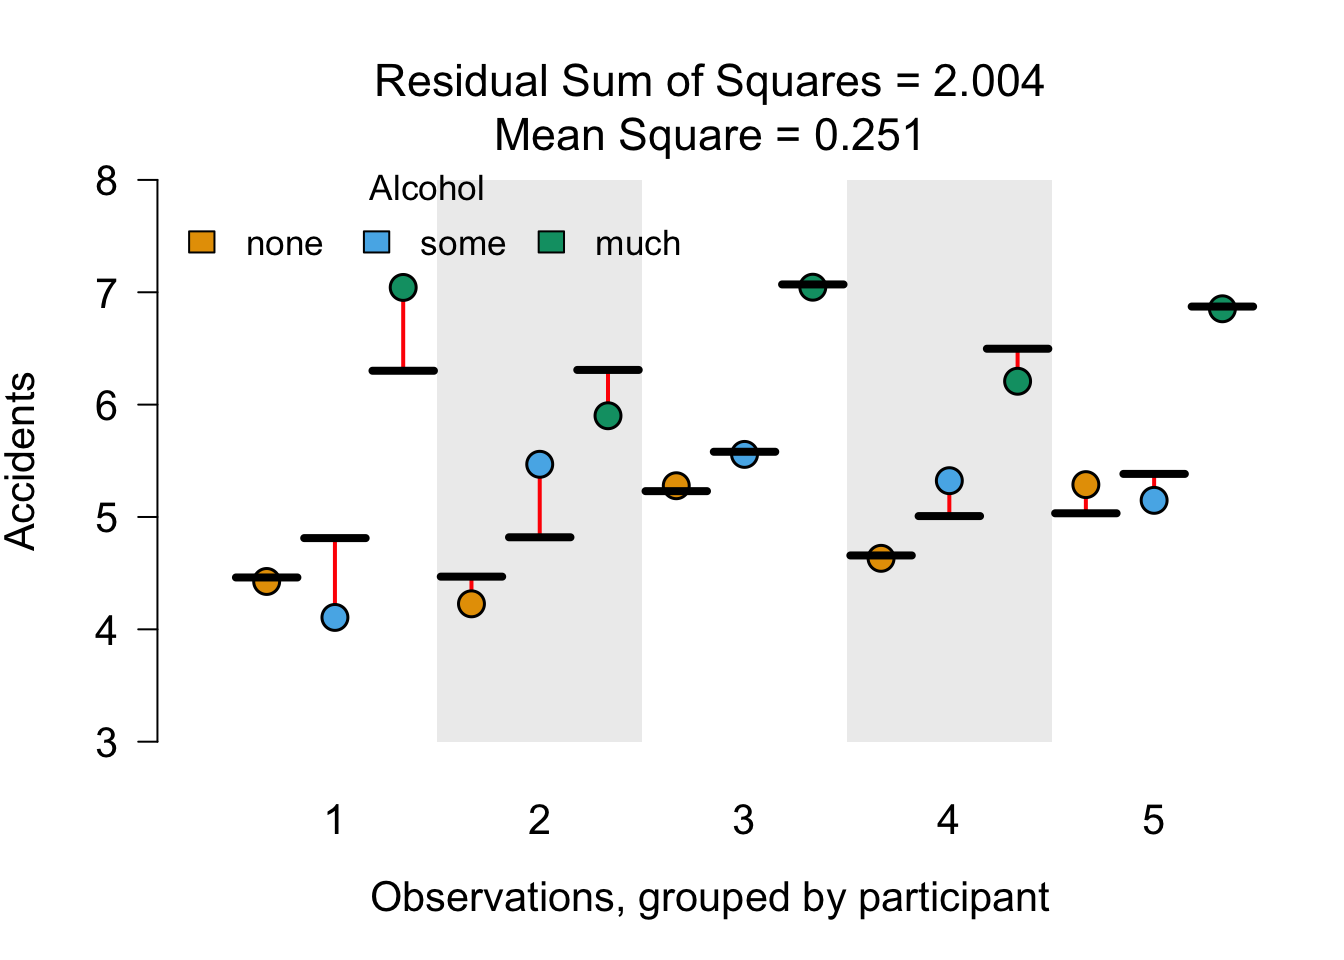
Variance in the alcohol data
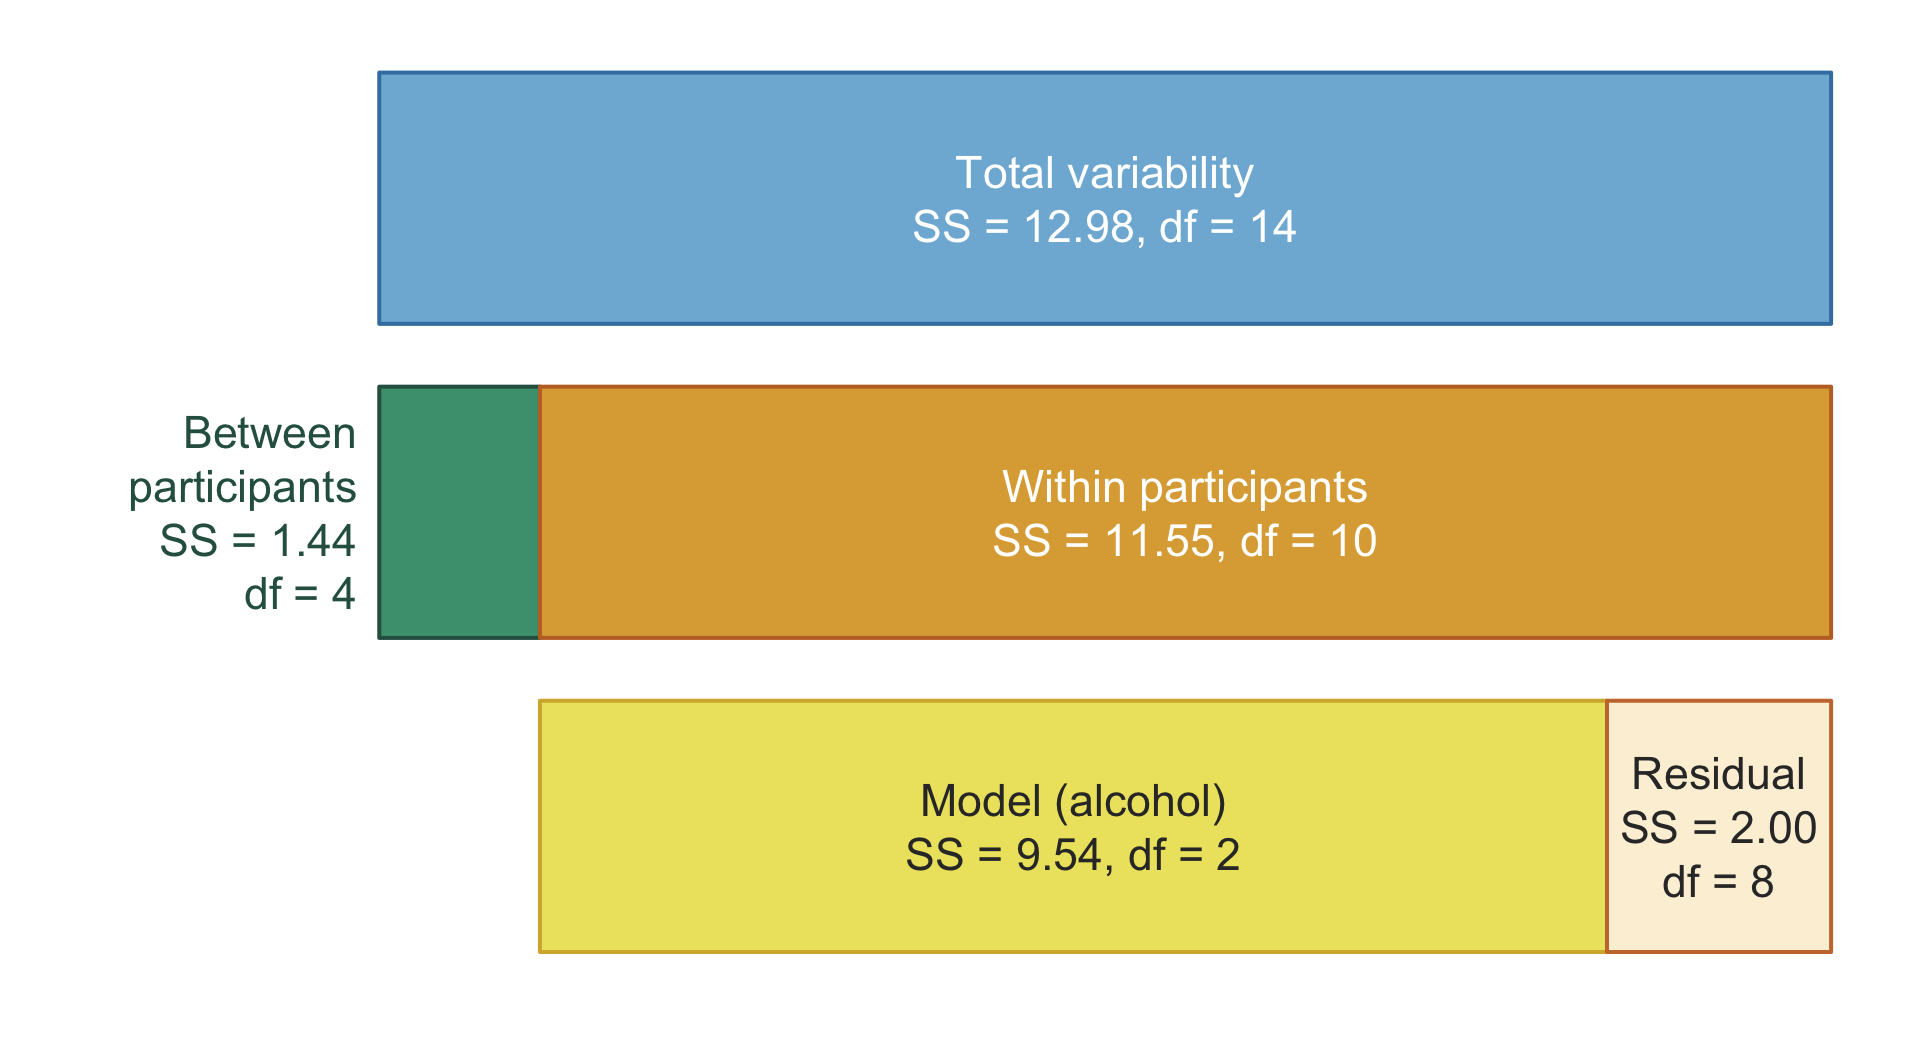
We use full model residual to compute F for alcohol
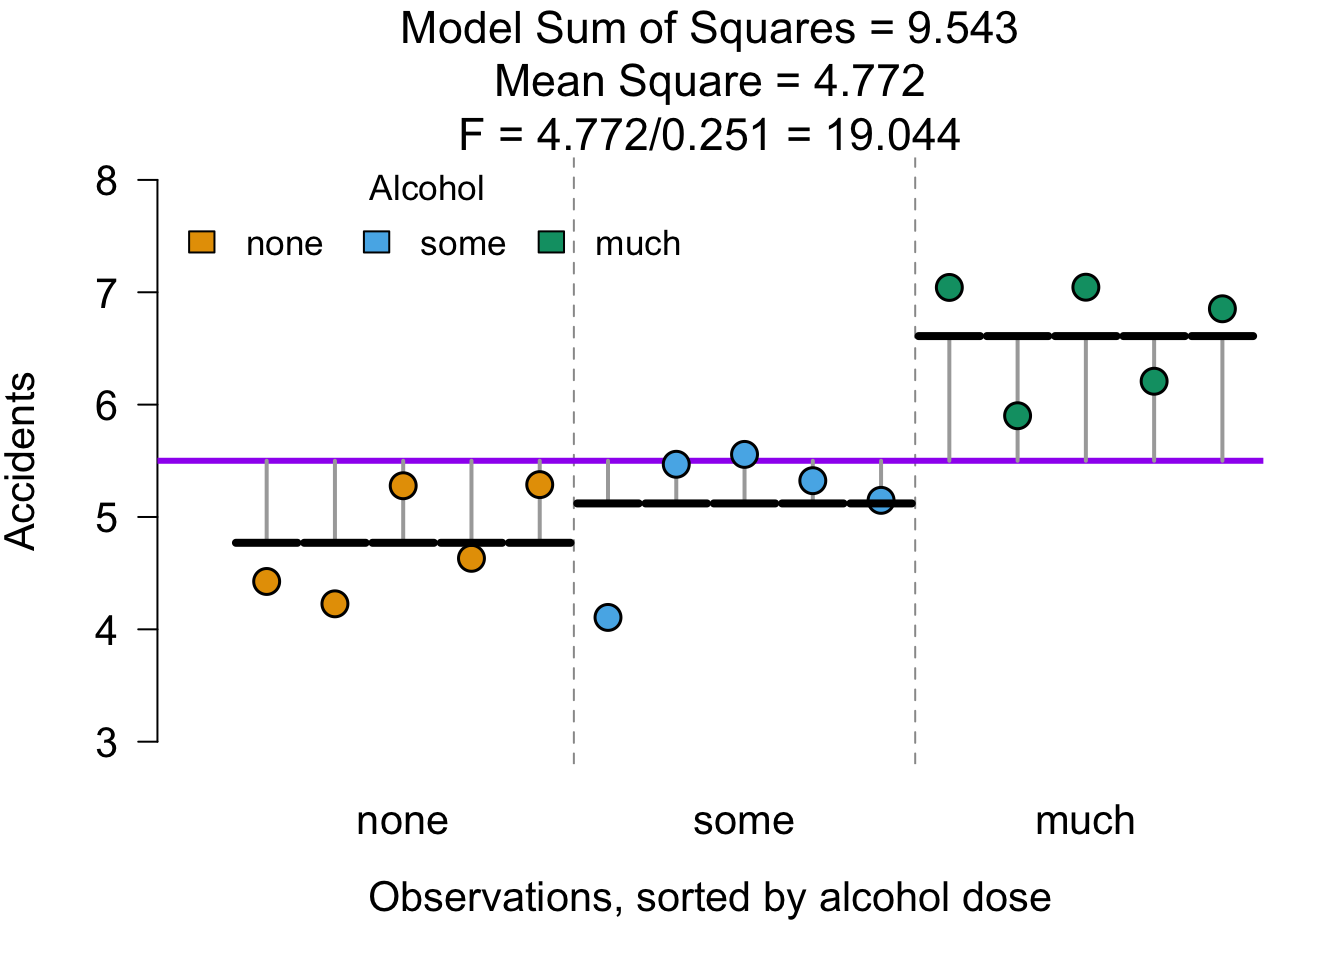
F ratio
\(F = \frac{{MS}_{{model}}}{{MS}_{{residual}}}\)
# Calculate F statistic
fStat <- MS_model / MS_error
fStat
[1] 19.04416P-value
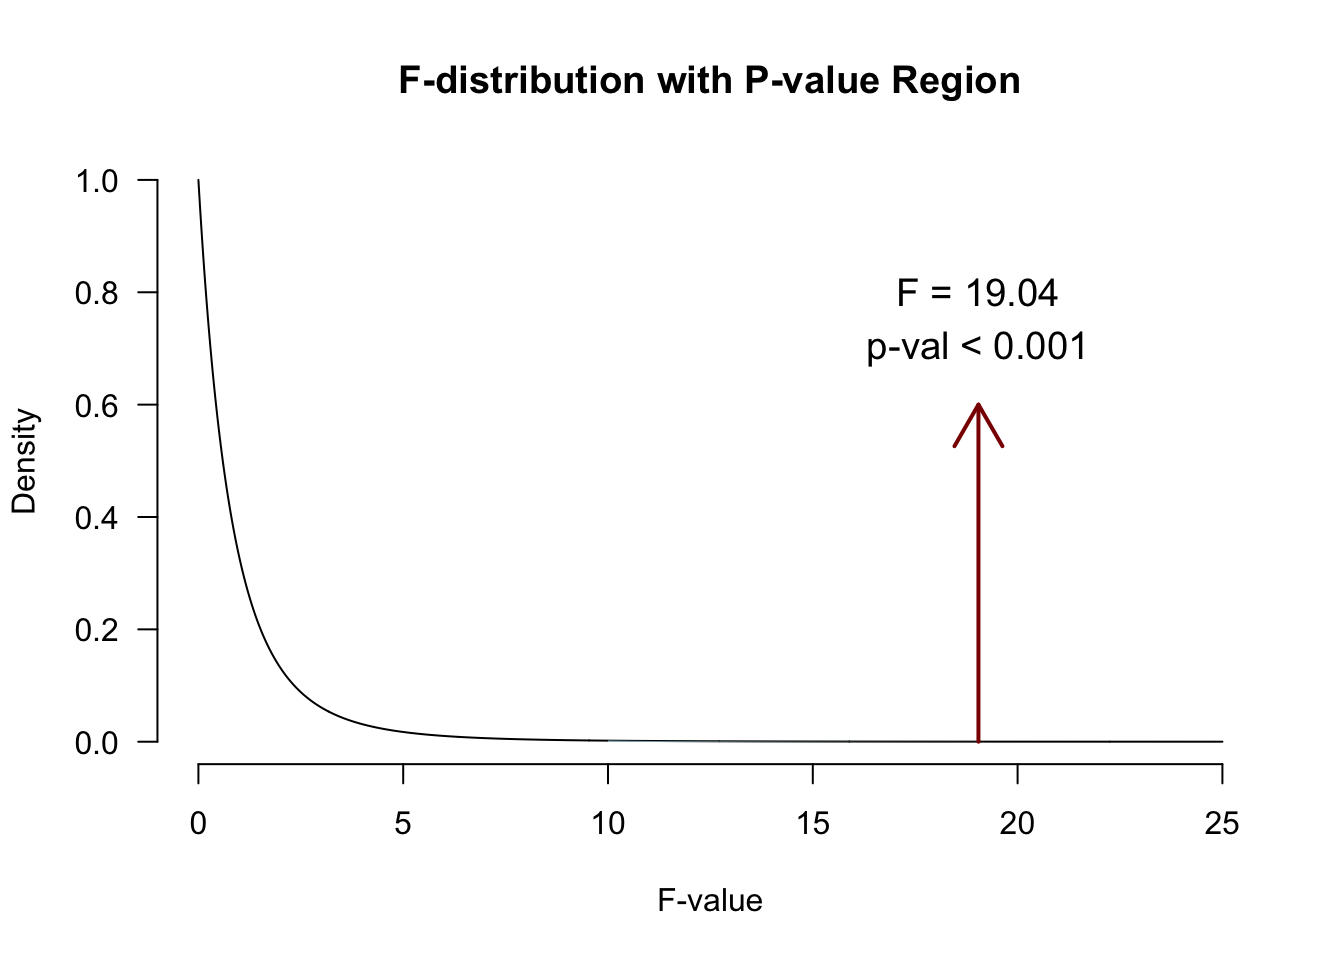
Contrast
Planned comparisons
- Exploring differences of theoretical interest
- Higher precision
- Higher power
Post-Hoc
Unplanned comparisons
- Exploring all possible differences
- Adjust p-value for inflated type 1 error
JASP
ANOVA factorial repeated
Factorial repeated measures ANOVA
The factorial repeated measures ANOVA analyses the variance of the model while reducing the error by the within person variance.
- 1 dependent/outcome variable
- 2 or more independent/predictor variable
- 2 or more levels
- All with same subjects
Assumptions
Same as one-way repeated measures ANOVA
Example
In this example we will again look at the amount of accidents in a car driving simulator while subjects were given varying doses of speed and alcohol. But this time we let participants partake in all conditions. Every week subjects returned for a different experimental condition.
- Dependent variable
- Accidents
- Independent variables
- Speed
- None
- Some
- Much
- Alcohol
- None
- Some
- Much
- Speed
Every participant is measured in every cell of the design
| person | 1_1 | 1_2 | 1_3 | 2_1 | 2_2 | 2_3 | 3_1 | 3_2 | 3_3 |
|---|---|---|---|---|---|---|---|---|---|
| 1 | ✓ | ✓ | ✓ | ✓ | ✓ | ✓ | ✓ | ✓ | ✓ |
| 2 | ✓ | ✓ | ✓ | ✓ | ✓ | ✓ | ✓ | ✓ | ✓ |
| 3 | ✓ | ✓ | ✓ | ✓ | ✓ | ✓ | ✓ | ✓ | ✓ |
| ⋮ | ⋮ | ⋮ | ⋮ | ⋮ | ⋮ | ⋮ | ⋮ | ⋮ | ⋮ |
| 20 | ✓ | ✓ | ✓ | ✓ | ✓ | ✓ | ✓ | ✓ | ✓ |
Data
Balanced by design
| Alcohol / speed | none | some | much |
|---|---|---|---|
| none | 20 | 20 | 20 |
| some | 20 | 20 | 20 |
| much | 20 | 20 | 20 |
- RM ANOVA only uses participants with all observations
- So every cell holds the same people, always balanced
- Between-subjects groups (mixed design) can still differ in size
- Balanced, so alcohol and speed are uncorrelated
Mixed design ANOVA
Mixed design
The mixed ANOVA analyses the variance of the model while reducing the error by the within person variance.
- 1 dependent/outcome variable
- 1 or more independent/predictor variable with different subjects
- 2 or more levels
- 1 or more independent/predictor variable with same subjects
- 2 or more levels
Assumptions
Same as repeated measures ANOVA and same as factorial ANOVA.
Example
- Dependent variable
- Accidents
- Independent variables
- Speed (same subjects)
- None
- Small
- Large
- Alcohol (same subjects)
- None
- Small
- Large
- Daytime
- Morning
- Evening
- Speed (same subjects)
Data
Further reading
JASP
Closing
Recap
- In a repeated measures design we can account for baseline differences, to reduce the overall model error
- With within-subjects predictors, we need to check:
- Sphericity (equal variances of difference scores)
- With between-subjects predictors, we need to check:
- Equal variances of groups
Next Time
- Non-parametric tests: rank-based equivalents of old friends (lecture 20)
Recommended Exercises
- Exercise 14.4
- Exercise 14.5
- To understand mechanics of RM ANOVA, Exercise 14.1
- No sums of squares or effect size calculations required for the exam
Labcoat Leni 14.1
Perham & Sykora (2012): Are splattered cadavers distracting?
Is recall affected by the sound played while learning letter sequences?
- Two within-subject factors: sound (quiet, liked or disliked music) × position in the list (1–8)
quiet_pos1todisliked_pos8: probability of correctly recalling a letter
Contact
