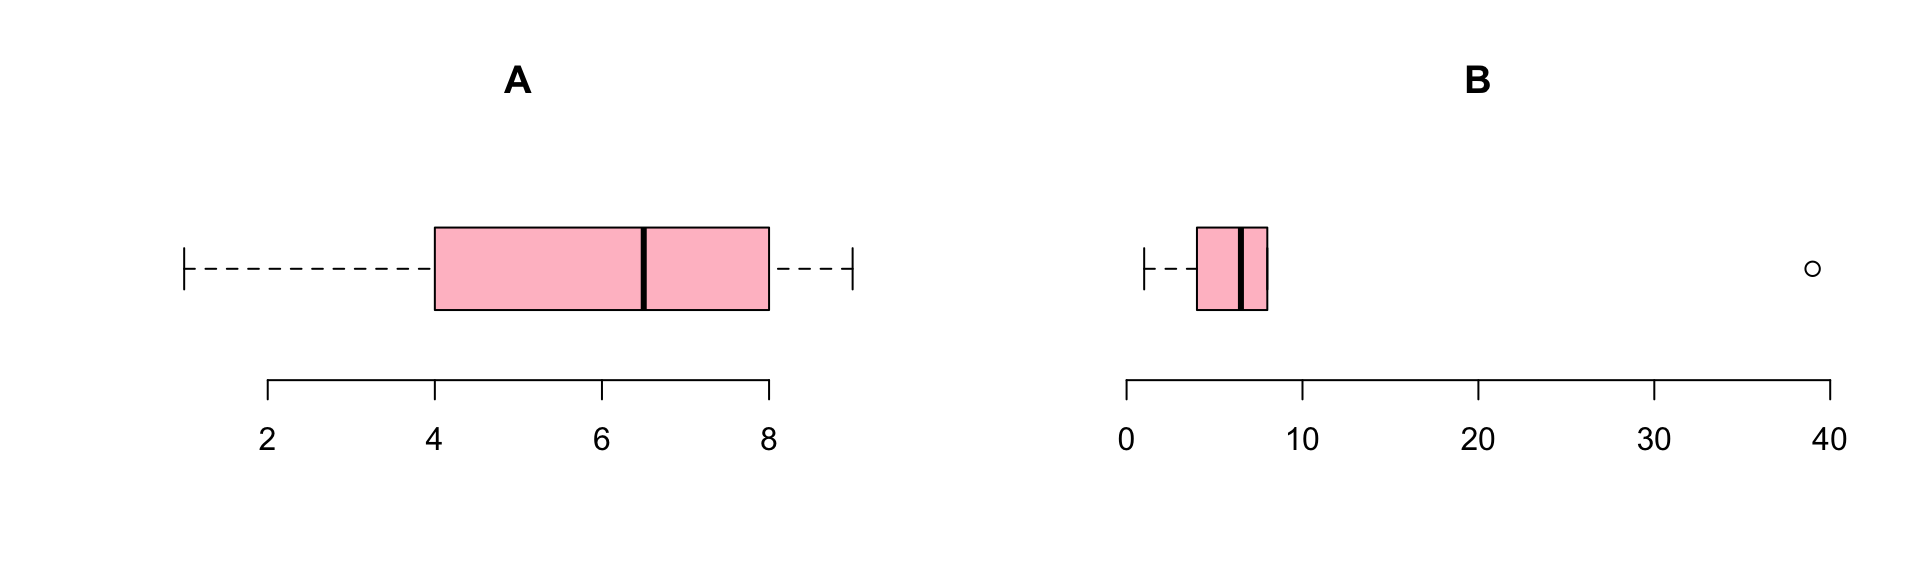
| A | 1 | 4 | 6 | 7 | 8 | 9 |
| B | 1 | 4 | 6 | 7 | 8 | 39 |
| rank(A) | 1 | 2 | 3 | 4 | 5 | 6 |
| rank(B) | 1 | 2 | 3 | 4 | 5 | 6 |
20. Non-parametric tests
Johnny van Doorn
University of Amsterdam
20 October 2026
In this lecture we aim to:
- Repeat some assumptions
- Introduce rank-based methods
- Look at rank-based equivalents to some old friends
- Show these in JASP
Reading: Chapter 15 (§15.1–15.9)
Nonparametric tests
- When assumptions are violated
- e.g., strong non-normality
- When the variable is ordinal
- e.g., when playing Mario Kart
- When unsure about outliers
- e.g., some observations with z \(\approx\) 3
- Topic of my dissertation!
I’m Ken Griffey on the Mariners
Okay, I’m way beyond the boundaries, outside of parameters
The rap chancellor, jacket made of camel fur
Mac Miller, Apparition (Faces)
Parametric vs Nonparametric
| Attribute | Parametric | Nonparametric |
|---|---|---|
| distribution | normally distributed | any distribution |
| sampling | random sample | random sample |
| sensitivity to outliers | yes | no |
| works with | large data sets | small and large data sets |
| speed | fast | slow |
Ranking
Ties
| index | 1 | 2 | 3 | 4 | 5 | 6 | 7 | 8 | 9 |
| x | 11 | 42 | 42 | 62 | 73 | 73 | 84 | 84 | 84 |
| ranks | 1 | 2.5 | 2.5 | 4 | 5.5 | 5.5 | 8 | 8 | 8 |
\[\frac{2 + 3}{2} = 2.5, \frac{5 + 6}{2} = 5.5, \frac{7 + 8 + 9}{3} = 8\]
Procedure
- Assumption: independent random samples.
- Hypothesis:
\(H_0\) : equal population distributions (implies equal mean ranking)
\(H_A\) : unequal mean ranking (two sided)
\(H_A\) : higher mean ranking for one group. - Test statistic is difference between mean or sum of ranking.
- Standardize test statistic to normal sampling distribution.
- Calculate P-value one or two sided.
- Conclude to reject \(H_0\) if \(p < \alpha\).
What does \(H_0\) state?
| Test | \(H_0\) |
|---|---|
| Wilcoxon rank-sum (Mann-Whitney) | Both groups come from the same population distribution |
| Wilcoxon signed-rank | Positive and negative differences are equally likely (symmetric around 0) |
| Kruskal-Wallis | All groups come from the same population distribution |
| Friedman’s ANOVA | Within each participant, every order of the conditions is equally likely |
- Under \(H_0\) the mean ranks are equal; rejecting it means one group or condition tends to score higher
- Not a test of means, and of medians only if the distributions have the same shape
Wilcoxon rank-sum test
Independent 2 samples
Also known as the Mann-Whitney U test
Wilcoxon rank-sum test
Developed by Frank Wilcoxon the rank-sum test is an nonparametric alternative to the independent samples t-test.
By ranking all values and then summing the ranks per group, one would expect under the null hypothesis, that the sum of ranks is approximately equal.
After standardizing the test statistic (summed ranks for one group), we can use the standard normal distribution as the sampling distribution.
Example
Data (.jasp) · Results (.jasp) · Results (.html)
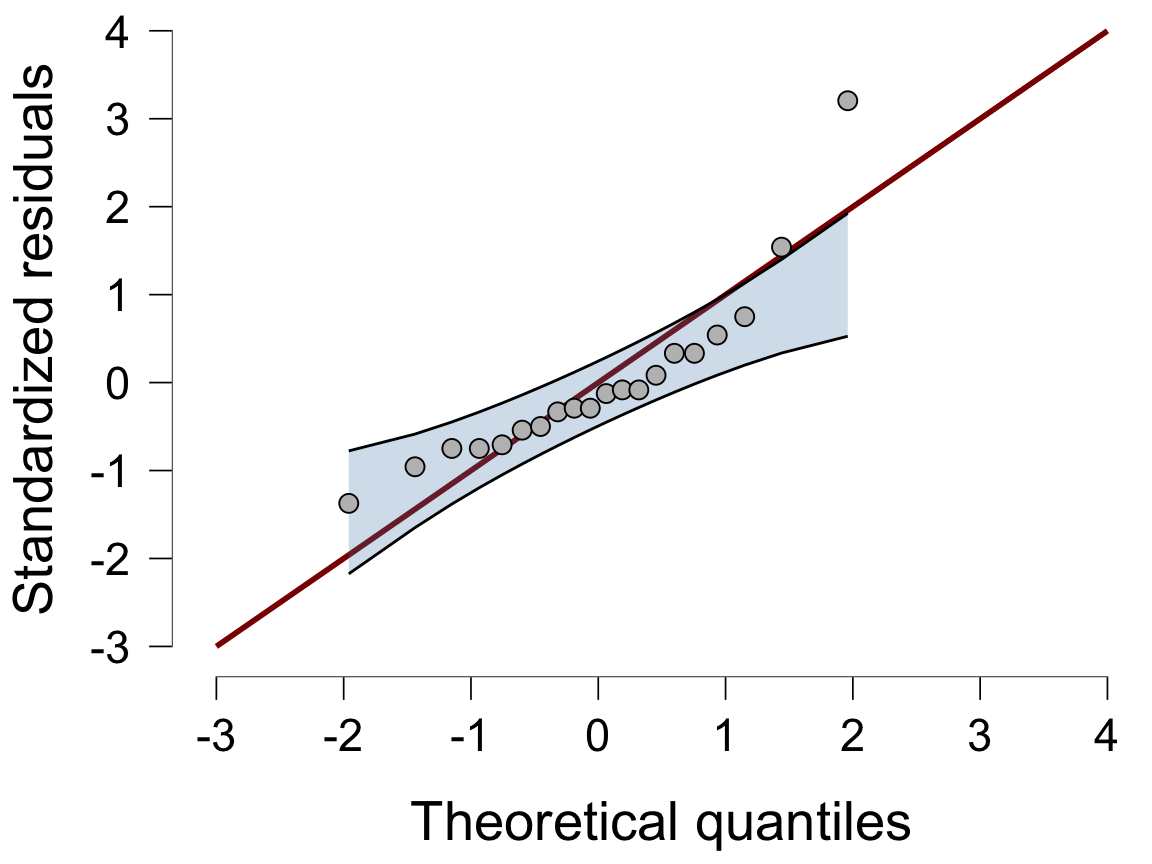
Q-Q plot of the residuals
Sunday BDI, independent \(t\)-test in JASP: Assumption Checks → Q-Q plot residuals → Confidence interval1
More on this in the extra text on skewed data (Student, Welch or Mann-Whitney?)
Test statistic W is the sum of ranks per group
     Drug rankedBDI
1 Alcohol      90.5
2 Ecstasy     119.5
We can take the sum of ranks for the first group as W:
Subtracting the minimum score
JASP reports the value of U, which is W with its minimum value subtracted:
- JASP (and the book) take the ecstasy group: 119.5 - 55 = 64.5
- The two add up to \(n_1 n_2\) = 100
Normal approximation for W
To calculate the Z-score we need to standardize the W. To do so we need the mean W and the standard error of W.
For this we need the sample sizes for each group.
Mean W under \(H_0\)
\[\bar{W}_s=\frac{n_1(n_1+n_2+1)}{2}\]
SE W
\[{SE}_{\bar{W}_s}=\sqrt{ \frac{n_1 n_2 (n_1+n_2+1)}{12} }\]
Calculate Z
\[z = \frac{W - \bar{W}}{{SE}_W}\]
Which looks a lot like
\[\frac{X - \bar{X}}{{SE}_X} \text{or} \frac{b - \mu_{b}}{{SE}_b} \]
Test for significance 2 sided
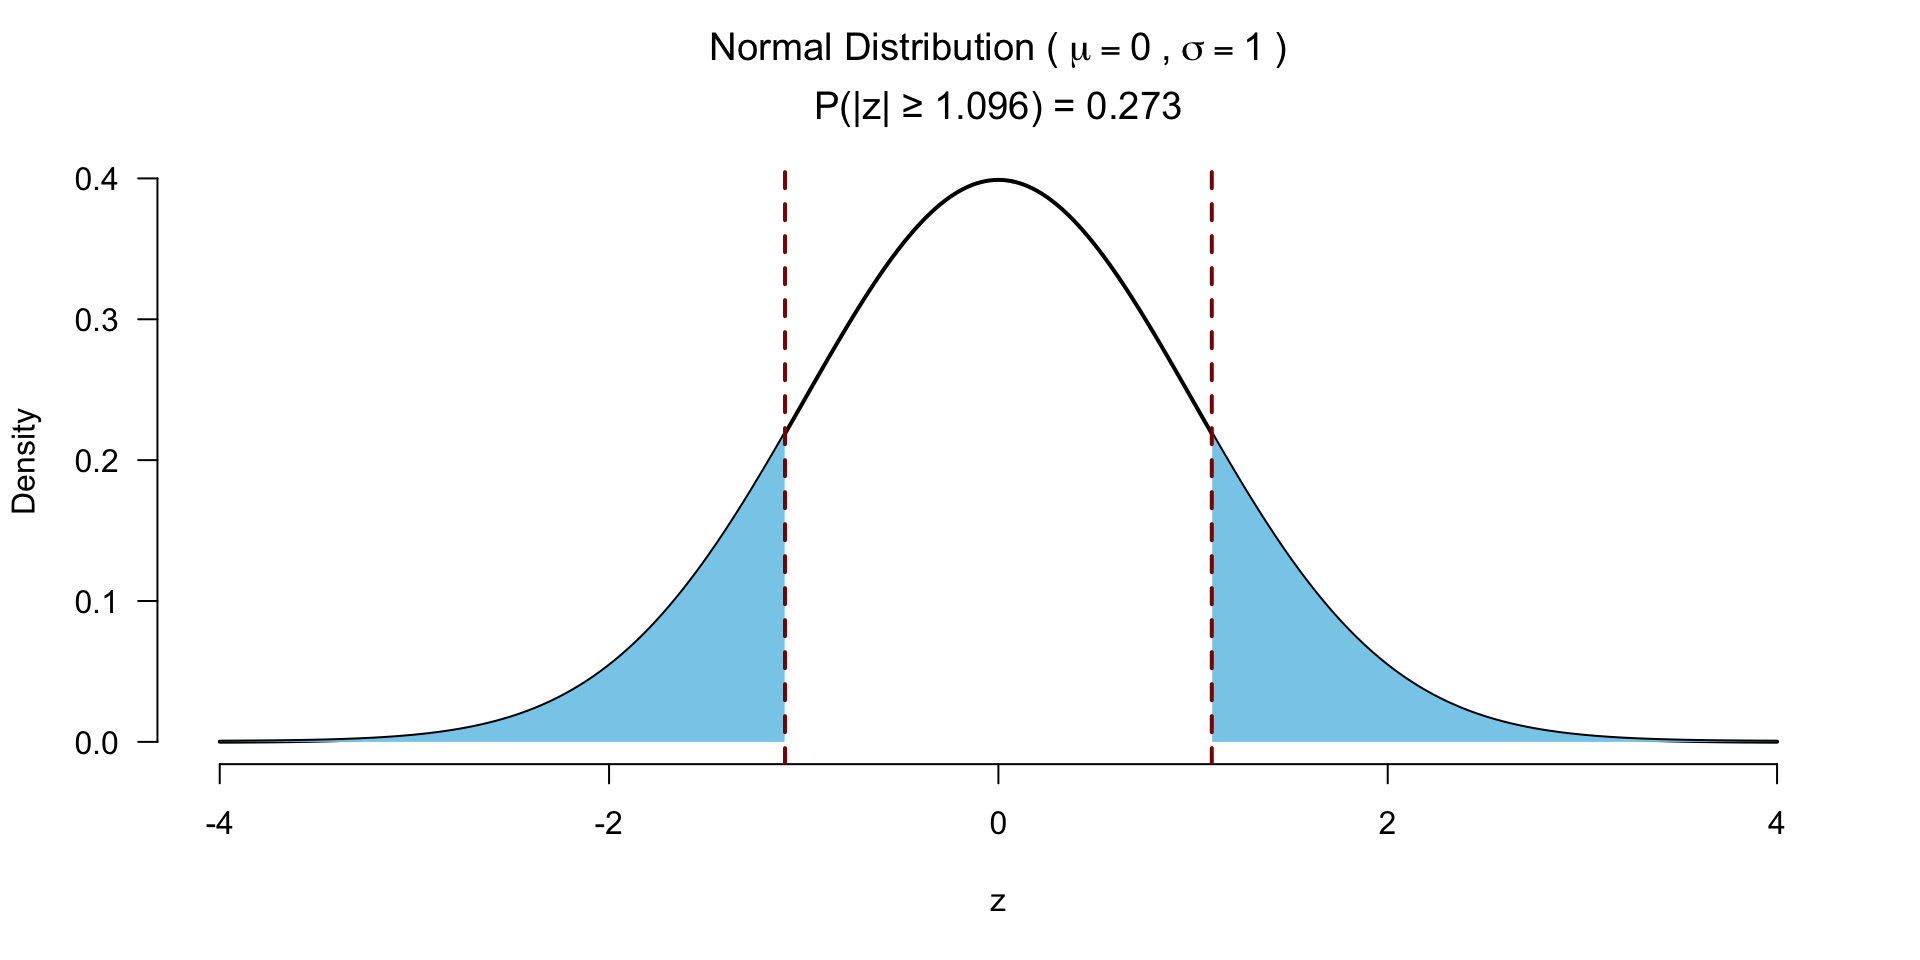
JASP: U = 64.5, p = .286, a bit higher because of a continuity correction (Jane Superbrain 15.2)
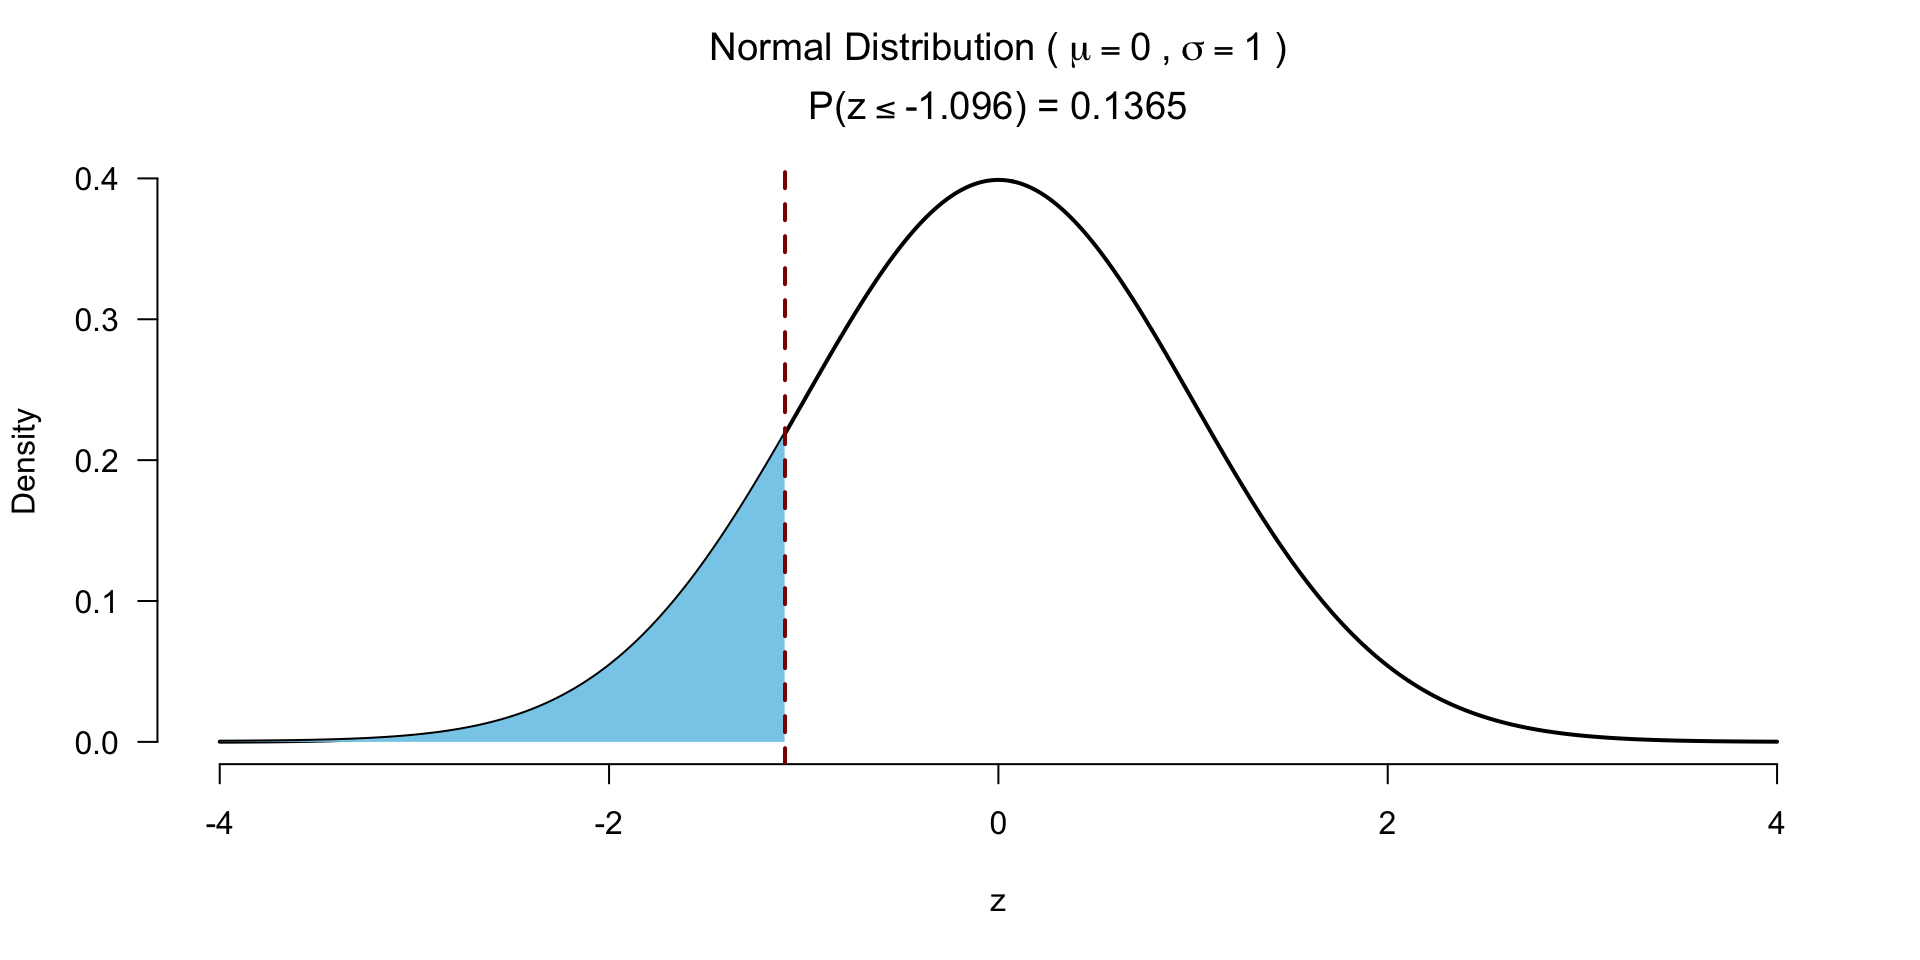
Test for significance 1 sided
Effect size rank-biserial correlation
\[r_{bs} = 1 - \frac{2*W}{n_1*n_2}\]
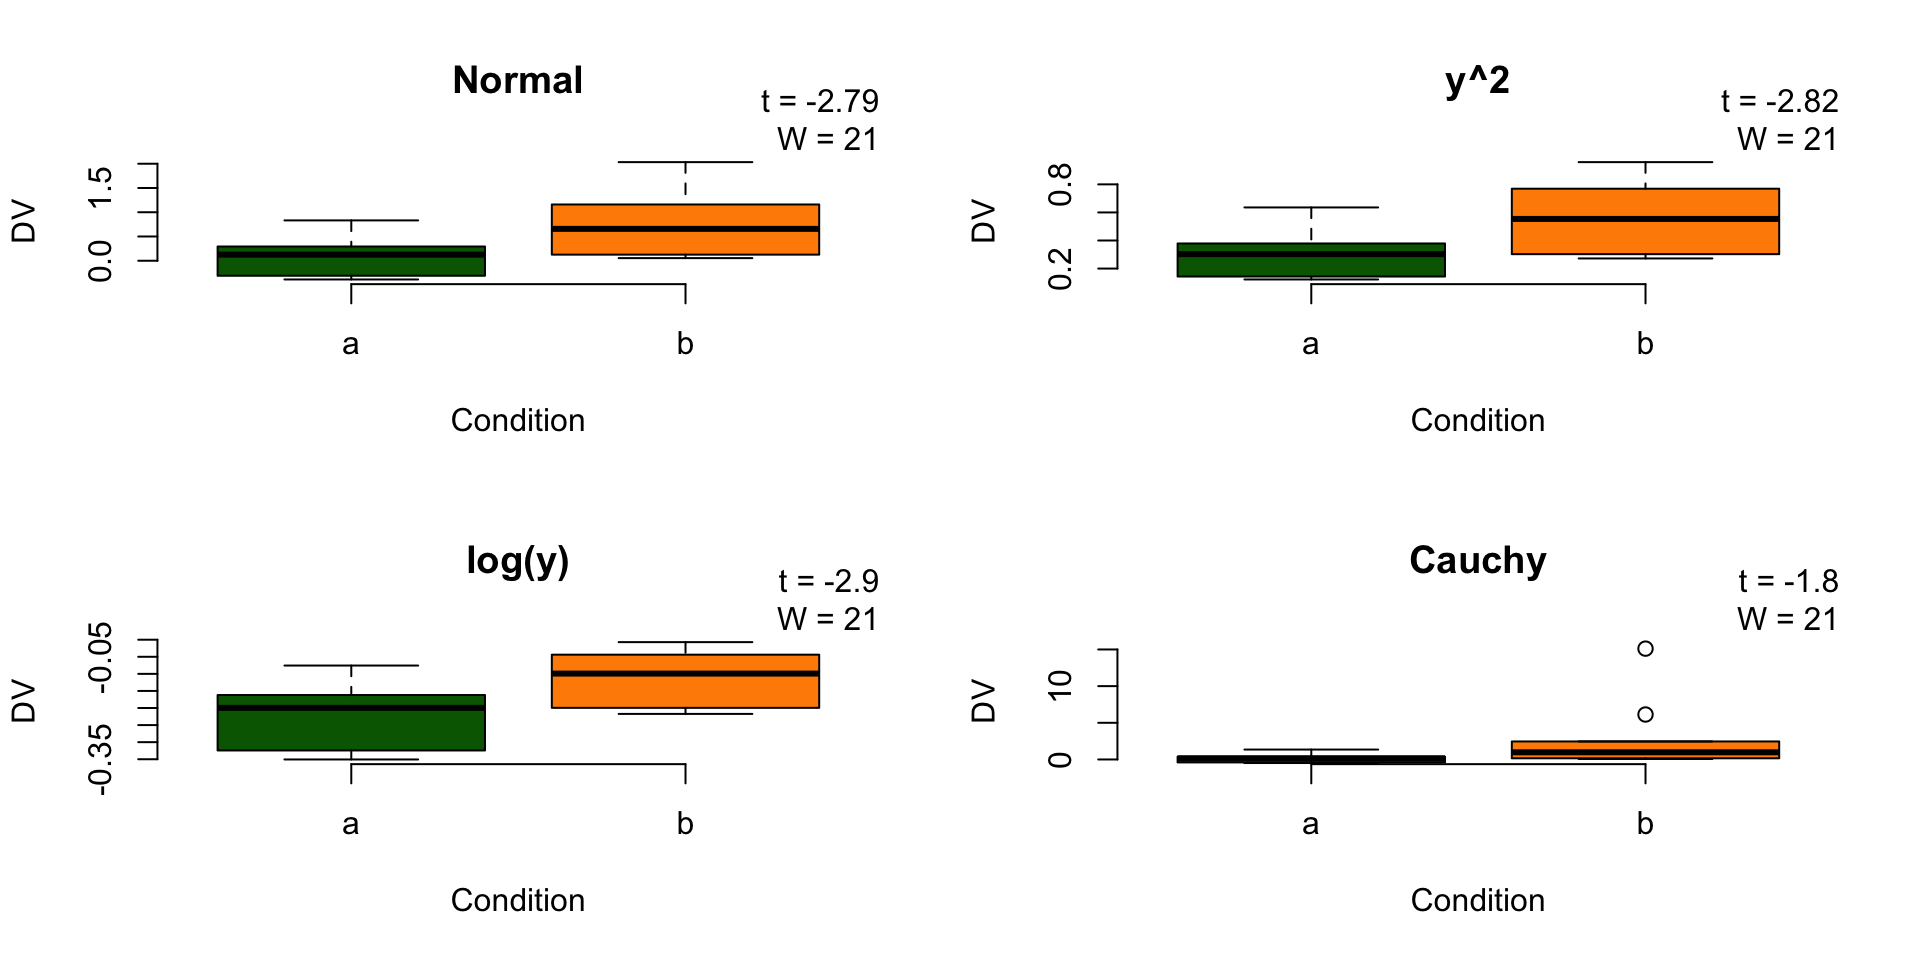
Robustness under monotonic transformations
Wilcoxon signed-rank test
Paired 2 samples
Wilcoxon signed-rank test
The Wilcoxon signed-rank test is a nonparametric alternative to the paired samples t-test. It assigns + or - signs to the difference between two repeated measures. By ranking the absolute differences and summing these ranks for the positive group, the null hypothesis is tested that positive and negative differences are equally likely.
Example
Data (.jasp) · Results (.jasp) · Results (.html)
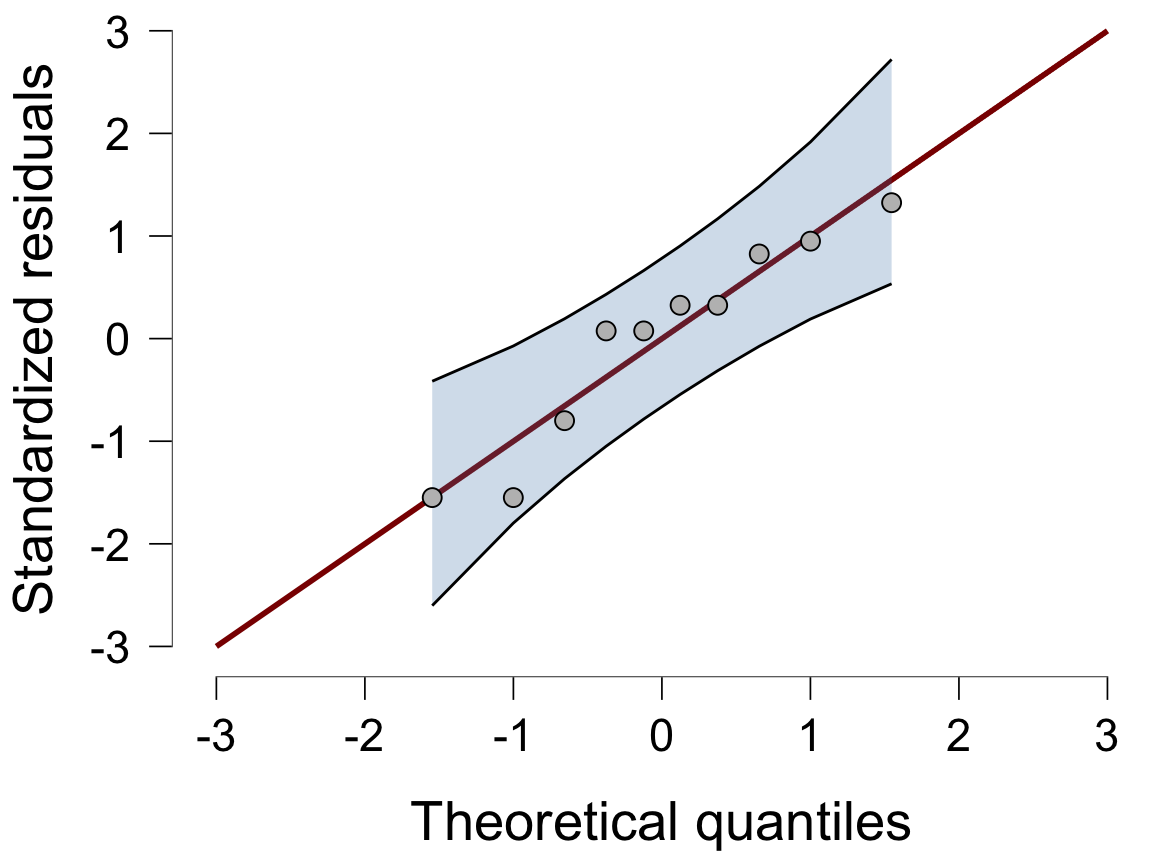
Q-Q plot of the differences
Paired samples \(t\)-test in JASP: Assumption Checks → Q-Q plot residuals → Confidence interval
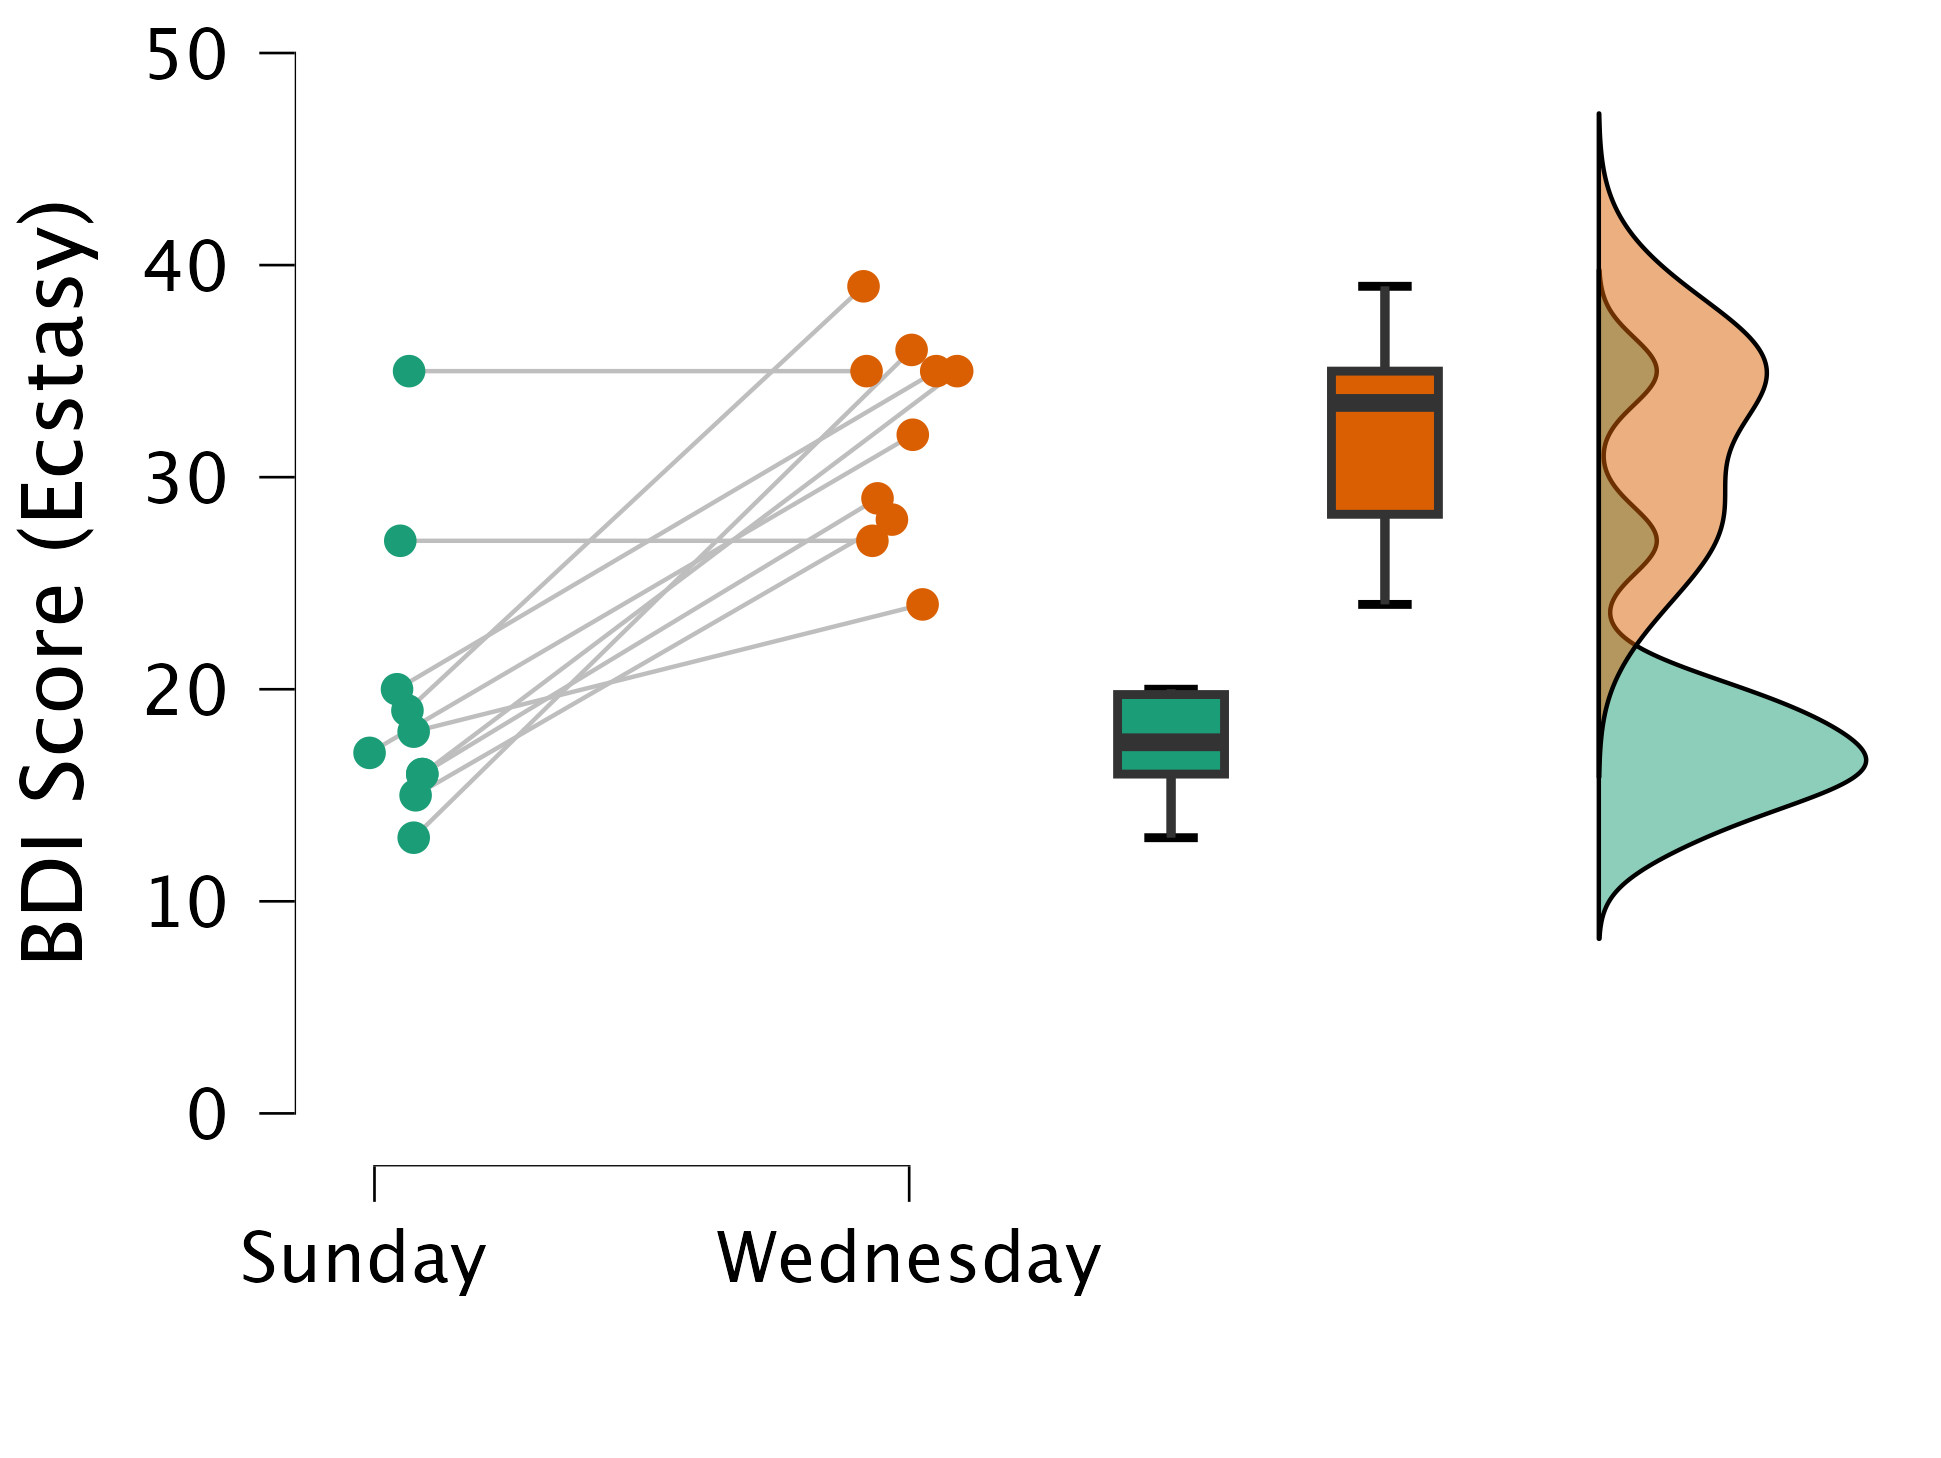
The plot
Calculate T
# Calculate difference in scores between second and first measure (as in the book)
data$diff = data$Wednesday - data$Sunday

# Calculate absolute difference in scores between second and first measure
data$abs.diff = abs(data$Wednesday - data$Sunday)

# Remove observations where the difference is 0
data <- data[data$diff != 0, ]

# Create rank variable
data$rank <- rank(data$abs.diff)

# Assign a '+' or a '-' to those values
data$sign <- sign(data$Wednesday - data$Sunday)
The data
Data (.jasp) · Results (.jasp) · Results (.html)
Calculate \(T_+\)
[1] 36[1] 8How likely is it to observe the highest possible rank sum (36), for \(n=8\), if there is no difference in BDI between Sunday and Wednesday?
Calculate \(\bar{T}\) and \({SE}_{T}\)
\[\bar{T} = \frac{n(n+1)}{4}\]
T_mean is the middle point between the minimum (0) and maximum possible (36) value for T
\[{SE}_{T} = \sqrt{\frac{n(n+1)(2n+1)}{24}}\]
Calculate Z
\[z = \frac{T_+ - \bar{T}}{{SE}_T}\]
Test for significance
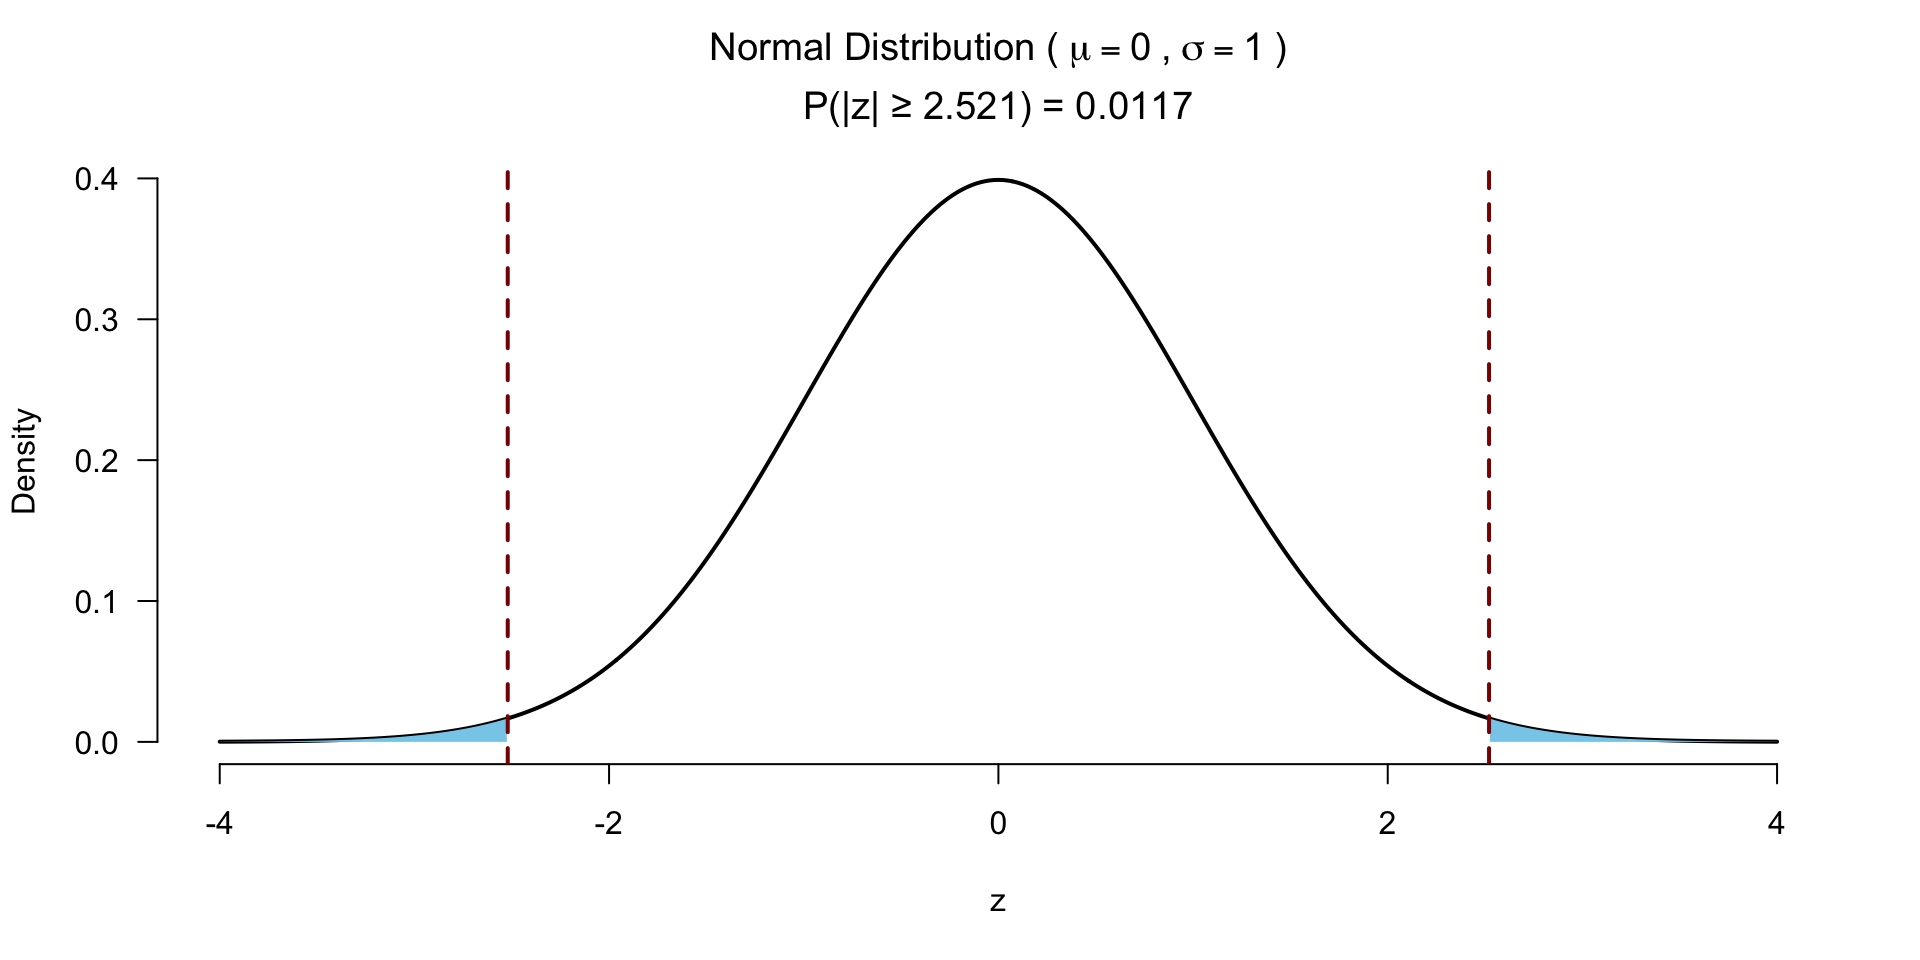
JASP: W = 36, p = .014, a bit higher because of a continuity correction (Jane Superbrain 15.2)
Effect size
- Matched rank-biserial correlation
\[r = \frac{T_+ - T_- }{T_+ + T_-}\]
Here \(T_+\) is the sum of the positive ranks (i.e., where Wednesday > Sunday), which is 36. \(T_-\) is the sum of the negative ranks, which do not exist. We have a maximum positive correlation (i.e., everybody with a difference scored higher on Wednesday).
Kruskal–Wallis test
Independent >2 samples
Kruskal–Wallis test
Created by William Henry Kruskal and Wilson Allen Wallis, the Kruskal-Wallis test is a nonparametric alternative to the independent one-way ANOVA.
The Kruskal-Wallis test essentially subtracts the expected mean ranking from each observed mean ranking, which is \(\chi^2\) distributed.
Assign ranks
The data
Data (.jasp) · Results (.jasp) · Results (.html)
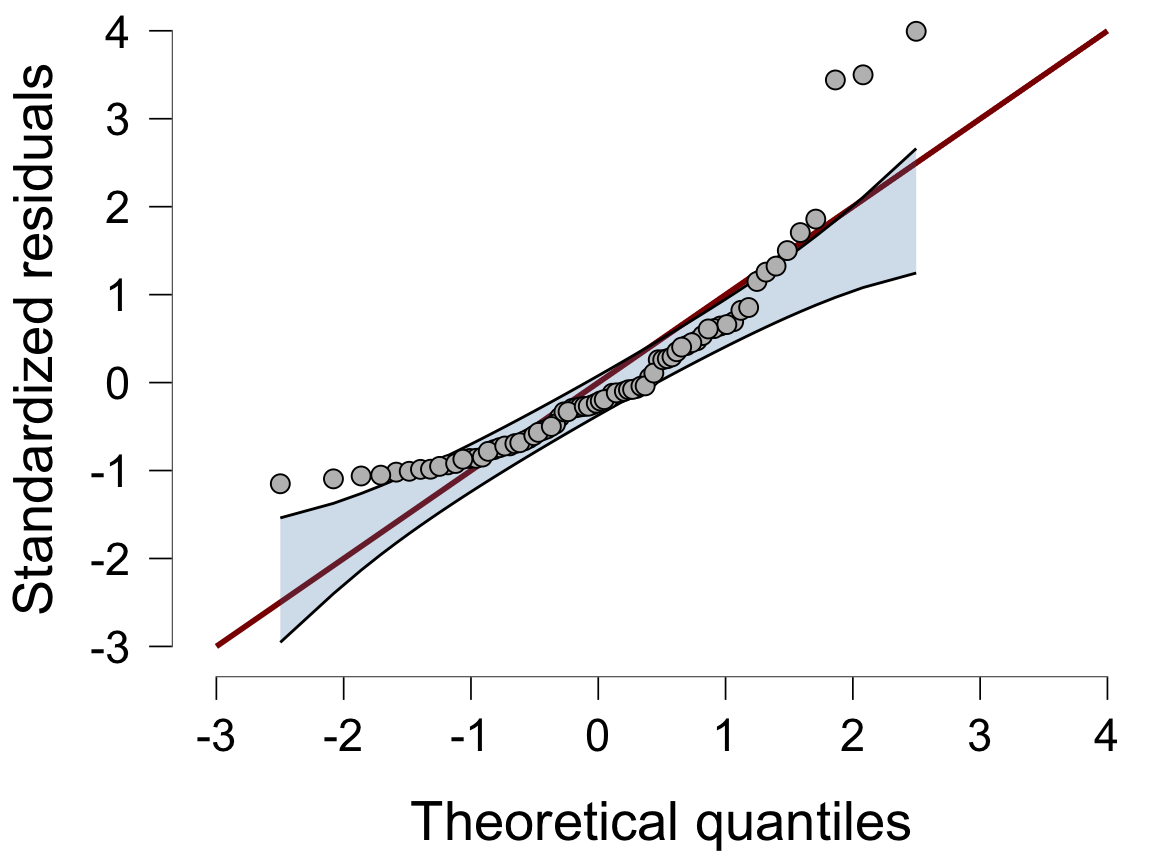
Q-Q plot of the residuals
One-way ANOVA in JASP (as in the book, Figure 15.10)
Calculate H
\[H = \frac{12}{N(N+1)} \sum_{i=1}^k \frac{R_i^2}{n_i} - 3(N+1)\]
- \(N\) total sample size
- \(n_i\) sample size per group
- \(k\) number of groups
- \(R_i\) rank sums per group
Calculate H
Calculate H
\[H = \frac{12}{N(N+1)} \sum_{i=1}^k \frac{R_i^2}{n_i} - 3(N+1)\]
And the degrees of freedom
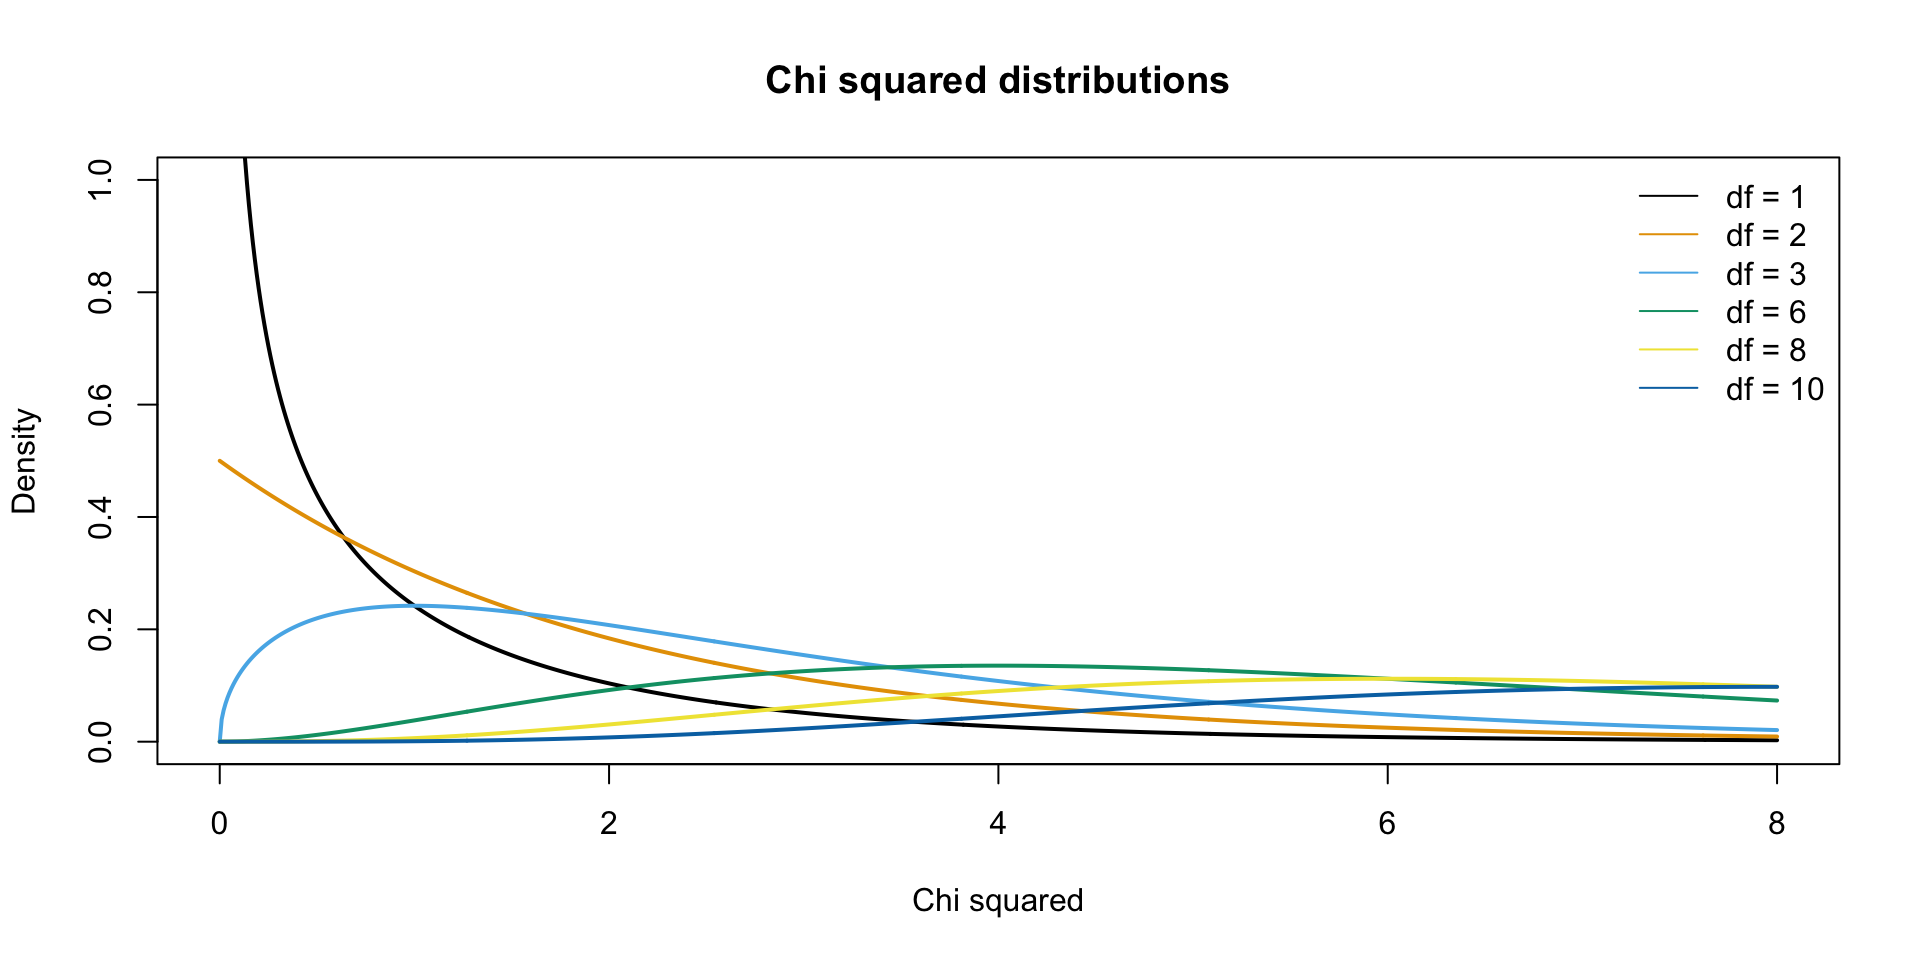
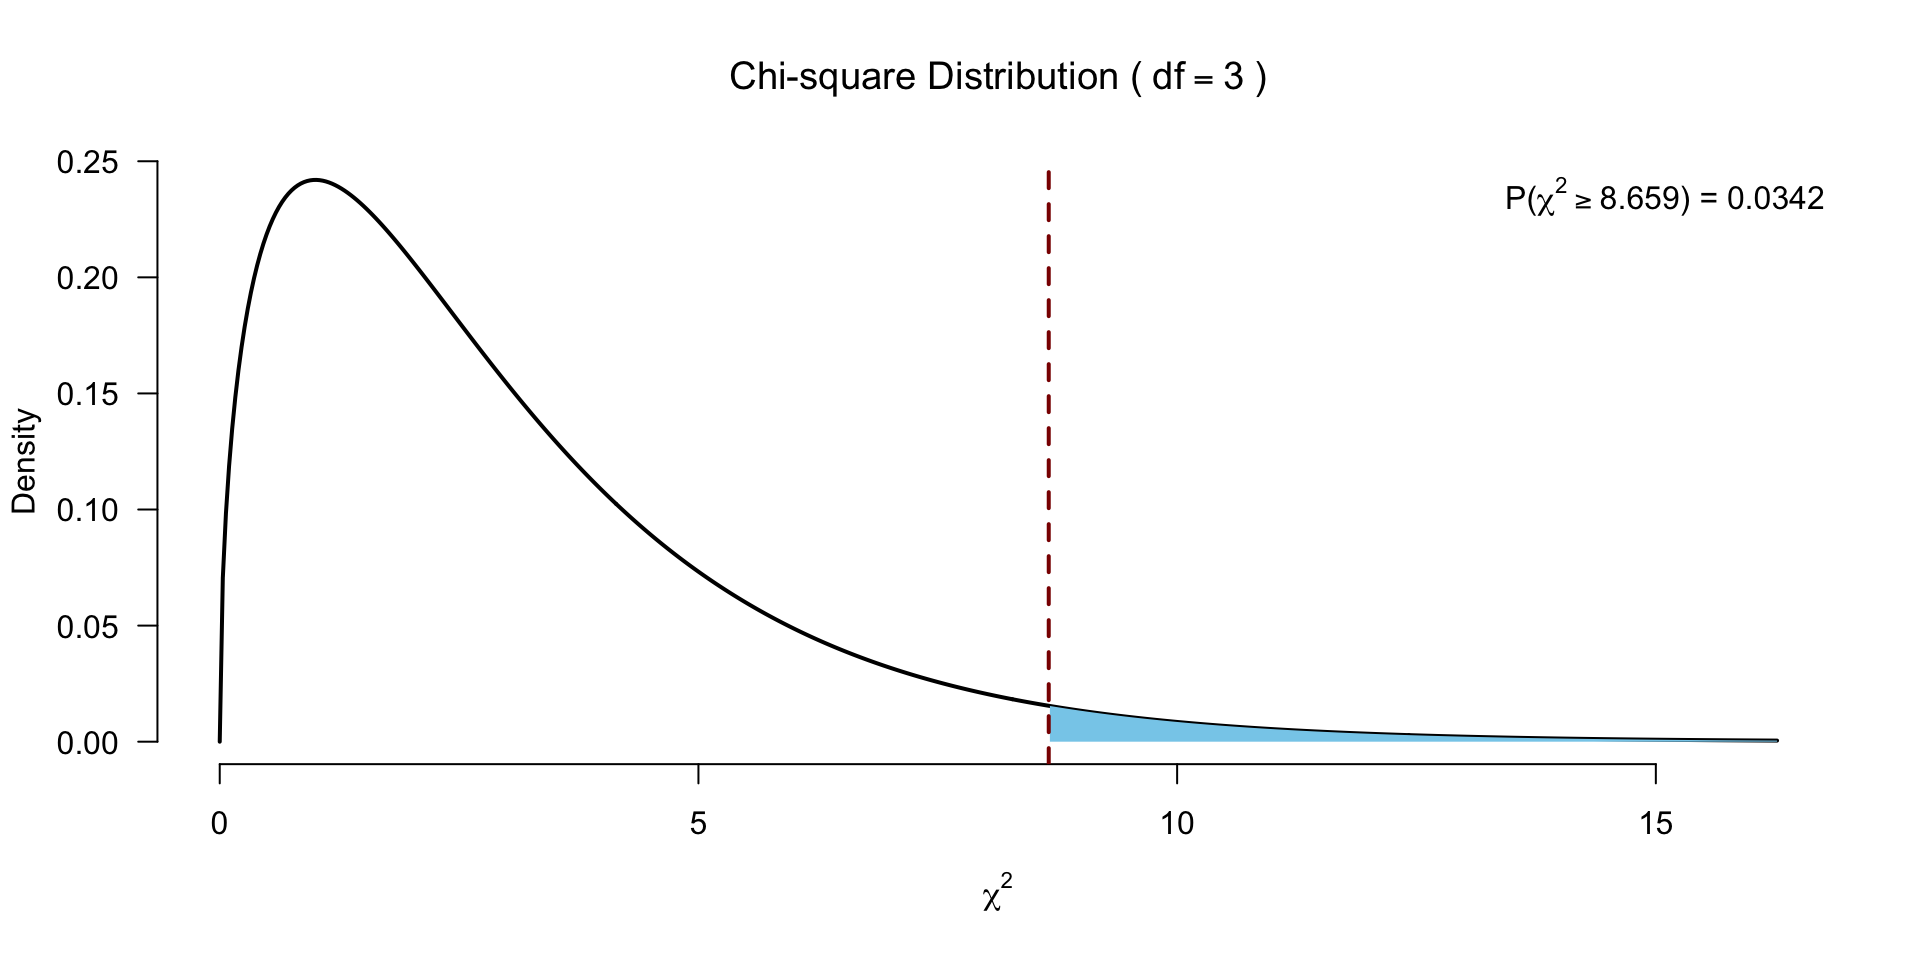
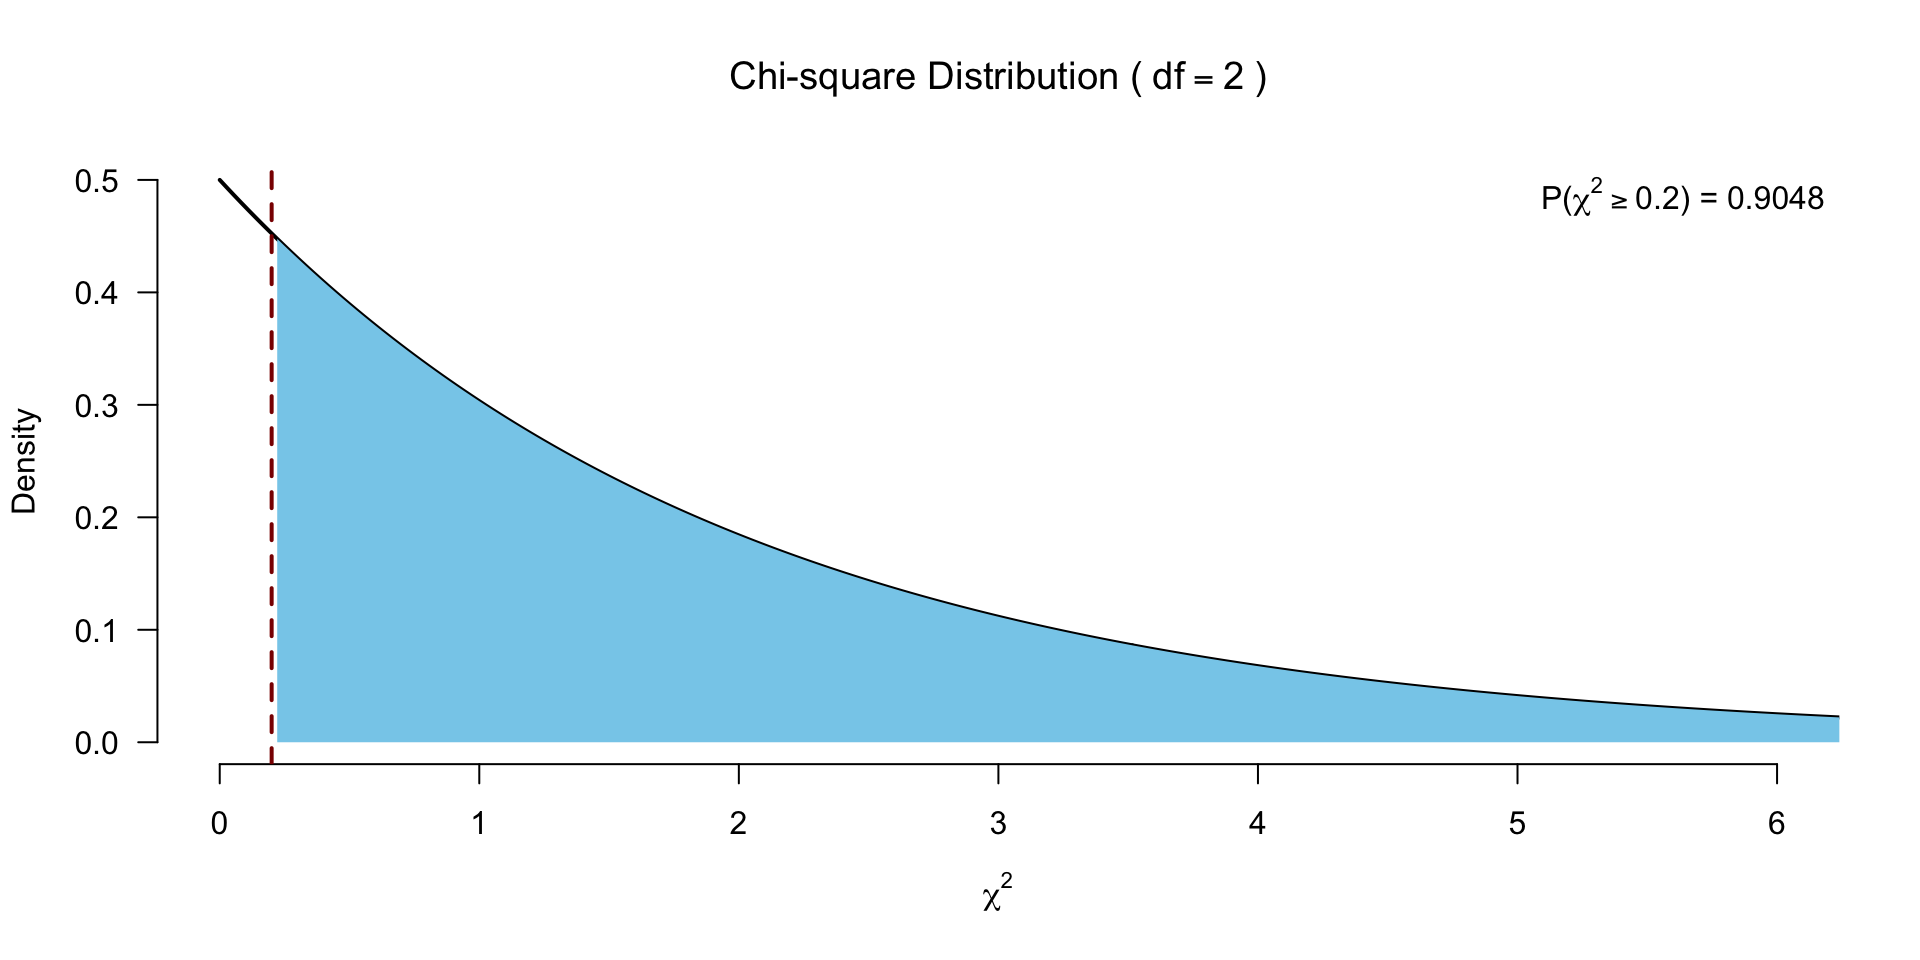
\(\chi^2\) distribution
The \(\chi^2\) distribution describes the test statistic under the assumption of \(H_0\), given the degrees of freedom.
Test for significance
Follow-up?
- Dunn’s post hoc test:
- Pairwise Mann-Whitney tests with adjusted p-values
Friedman’s ANOVA
Paired >2 samples
Friedman’s ANOVA
Created by Milton Friedman the Friedman’s ANOVA is a nonparametric alternative to the repeated one-way ANOVA.
Just like the Kruskal-Wallis test, Friedman’s ANOVA, subtracts the expected mean ranking from the calculated observed mean ranking, which is also \(\chi^2\) distributed.
The data
Data (.jasp) · Results (.jasp) · Results (.html)
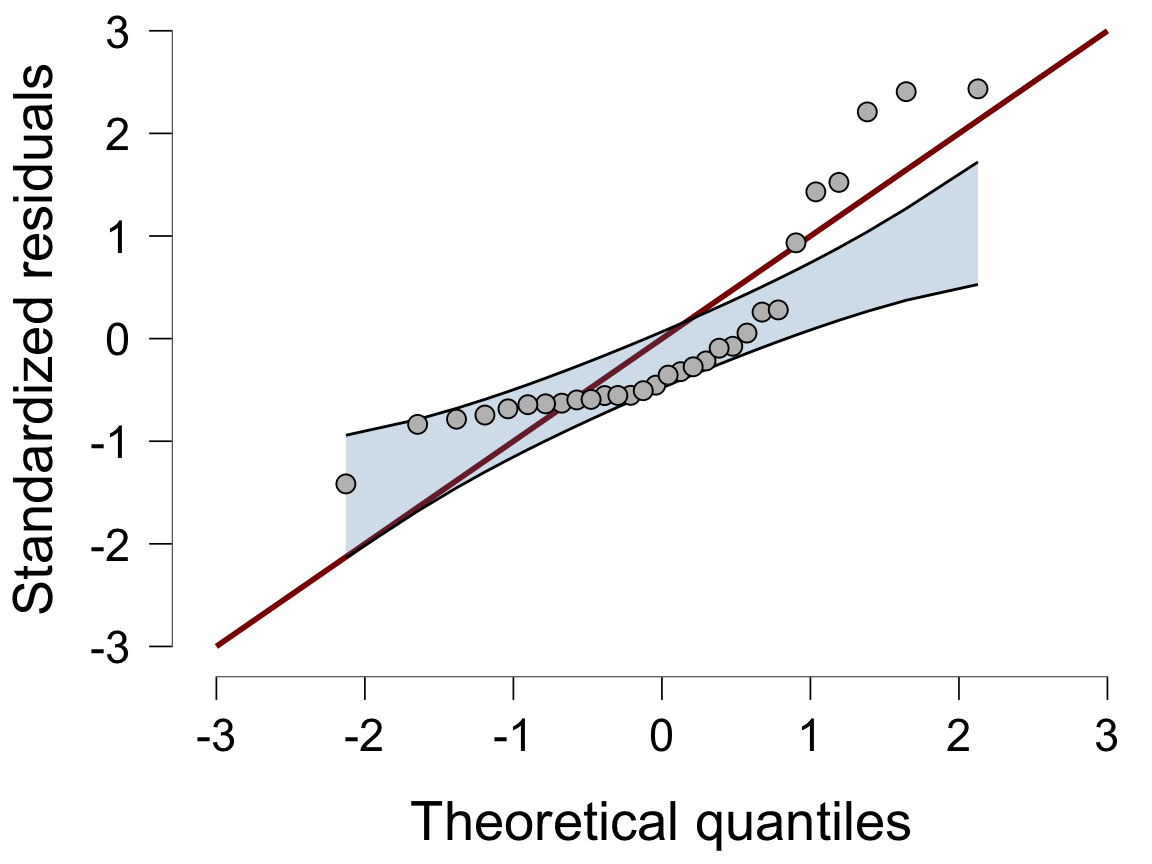
Q-Q plot of the residuals
Repeated measures ANOVA in JASP (as in the book, Figure 15.13)
Assign ranks
Rank within each participant (i.e., within each row).
The data with ranks
Calculate \(F_r\)
\[F_r = \left[ \frac{12}{Nk(k+1)} \sum_{i=1}^k R_i^2 \right] - 3N(k+1)\]
- \(N\) total number of subjects
- \(k\) number of groups
- \(R_i\) rank sums for each group
–> We sum the ranks for each of the three experimental conditions (and apply some standardizations).
Calculate \(F_r\) (without adjusting for ties)
Calculate ranks sum per condition and \(N\).
 Start_R Month1_R Month2_R
19 20 21 Adjusting for ties (just for fun)
\[ \frac{(k-1) \sum_i^k (R_i - \frac{b(k+1))}{2})^2}{\sum_i^b \sum_j^k (R_{ij}^2) - \frac{bk(k+1)^2}{4}} \]
k <- 3
b <- 10
F.r <- (sum ((R.i - ((b*(k+1))/2) )^2) * (k-1)) / (sum((ranks^2)) - (b*k *(k+1)^2) / 4)
F.r
[1] 0.2And the degrees of freedom
Test for significance
Post hoc tests?
- Conover test
- Follow up with Wilcoxon signed-rank tests!
JASP

Closing
Recap
- Non-parametric tests are rank-based, which means they are robust to:
- Non-normality
- Transformations of the data
- Outliers
Recap lecture 18
Accidents in a driving simulator, for every combination of alcohol and speed
pp, participant numberDaytime, morning or eveningnone_alc_none_speedtomuch_alc_much_speed, accidents in each of the 9 combinations
Recap lecture 18: \(t\)-test = ANOVA = regression
The same pre- and posttest scores, analyzed in two ways
- Ignoring participants, independent \(t\)-test = one-way ANOVA = regression
- Accounting for participants, paired \(t\)-test = RM ANOVA = ANOVA or regression with
id y,idandtime-point, long format (one row per measurement)pre-test,post-testanddiff-scores, wide format (one row per participant)
Exam note: assumptions per analysis
- All analyses below assume normal residuals (Q-Q plot with confidence band)
- Violations (normality, variances, sphericity) mess up Type I/II error rates
- How to assess them (next slides)
| Analysis | Also assumes | If unequal variances or no sphericity | If non-normal |
|---|---|---|---|
| Paired \(t\)-test | – | – | Wilcoxon signed-rank |
| Independent \(t\)-test | Equal variances | Welch \(t\) | Mann-Whitney |
| One-way ANOVA | Equal variances | Welch \(F\) | Kruskal-Wallis |
| Factorial ANOVA | Equal variances | – | – |
| ANCOVA | Equal variances, independent covariate, equal slopes | – | – |
| RM ANOVA | Sphericity (3+ levels) | Greenhouse-Geisser | Friedman (one-way only) |
| Mixed ANOVA | Equal variances, sphericity | Greenhouse-Geisser | – |
Exam note: checking assumptions
What you should know: how to assess, robust alternatives, and why these assumptions matter
- No assumption NHST (Shapiro-Wilk, Levene’s) on the exam (see Jane Superbrain Box 6.7)
- Normality: Q-Q plot of the residuals, with confidence interval
- Assumption Checks → Q-Q plot residuals → Confidence interval
- Points outside the band suggest non-normality
- Equal variances: ratio of the largest to the smallest variance (Section 6.9.6)
- Ratio of 2 or more suggests unequal variances
- Equivalently for sd’s: ratio of \(\sqrt{2} \approx 1.4\) or more
Exam note: robust alternatives
- Unequal variances:
- Welch \(t\)-test
- Welch \(F\) (one-way ANOVA only: Assumption Checks → Homogeneity corrections)
- Non-normality: nonparametric test (Chapter 15; lecture 20)
- Mann-Whitney, Wilcoxon signed-rank, Kruskal-Wallis, Friedman
- Question can give a decision rule, e.g., “use nonparametric test if more than 5 points fall outside the Q-Q confidence band”
- ANCOVA: no robust version, so have to eat the grain of salt if normality or variances seem problematic
Exam note: ANCOVA assumptions
- Independence of the covariate and treatment effect
- ANOVA with the covariate as dependent variable
- What it means: groups differ on the covariate
- Homogeneity of regression slopes: interaction covariate * independent variable
- Model → Model Terms: add or remove the interaction
- What it means: effect of the covariate differs between groups
Exam note: lectures 17 and 18
- Post hoc tests (lecture 17)
- Know where the options are, exam question will inform you which correction to use
- RM ANOVA (lecture 18)
- No sums of squares or effect size calculations required for the exam
Next Time
- Multiple regression (lecture 21)
Recommended Exercises
Labcoat Leni 15.1
Matthews et al. (2007): Having a quail of a time?
Do males fertilize more eggs when mating in the context that signalled a mating opportunity?
signalled: eggs fertilized in the male’s signalled contextcontrol: eggs fertilized in the male’s control context- Both males mated with the same 14 females
Labcoat Leni 15.2
Çetinkaya & Domjan (2006): Eggs-traordinary
Do fetishistic quail fertilize more eggs and initiate sex more quickly?
groups: fetishistic, non-fetishistic or controlegg_percent: percentage of eggs fertilizedlatency: time taken to initiate copulation
Contact


Scientific & Statistical Reasoning