21. Multiple regression
Block 3: Life is Continuous
- Regression with multiple predictors
- Mediation effects
- Interaction effects
- Chi-square
- Bayes!
In this lecture we aim to:
- Repeat some regression
- Look at multiple predictors
- Show these in JASP
Reading: Chapter 8 (§8.9–8.16)
Multiple regression
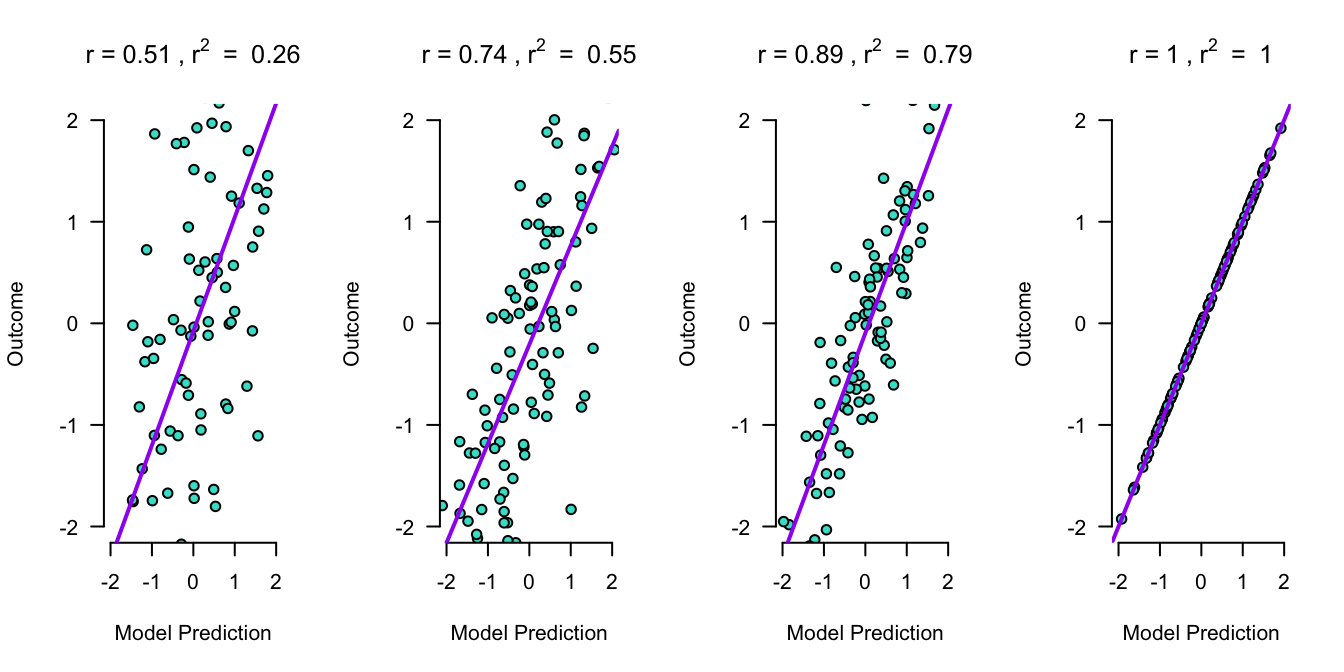
\(\LARGE{\text{outcome} = \text{model prediction} + \text{error}}\)
In statistics, linear regression is a linear approach for modeling the relationship between a scalar dependent variable y and one or more explanatory variables denoted X.
\(\LARGE{Y_i = \beta_0 + \beta_1 X_{1i} + \beta_2 X_{2i} + \dotso + \beta_n X_{ni} + \epsilon_i}\)
In linear regression, the relationships are modeled using linear predictor functions whose unknown model parameters \(\beta\)’s are estimated from the data.
Source: wikipedia
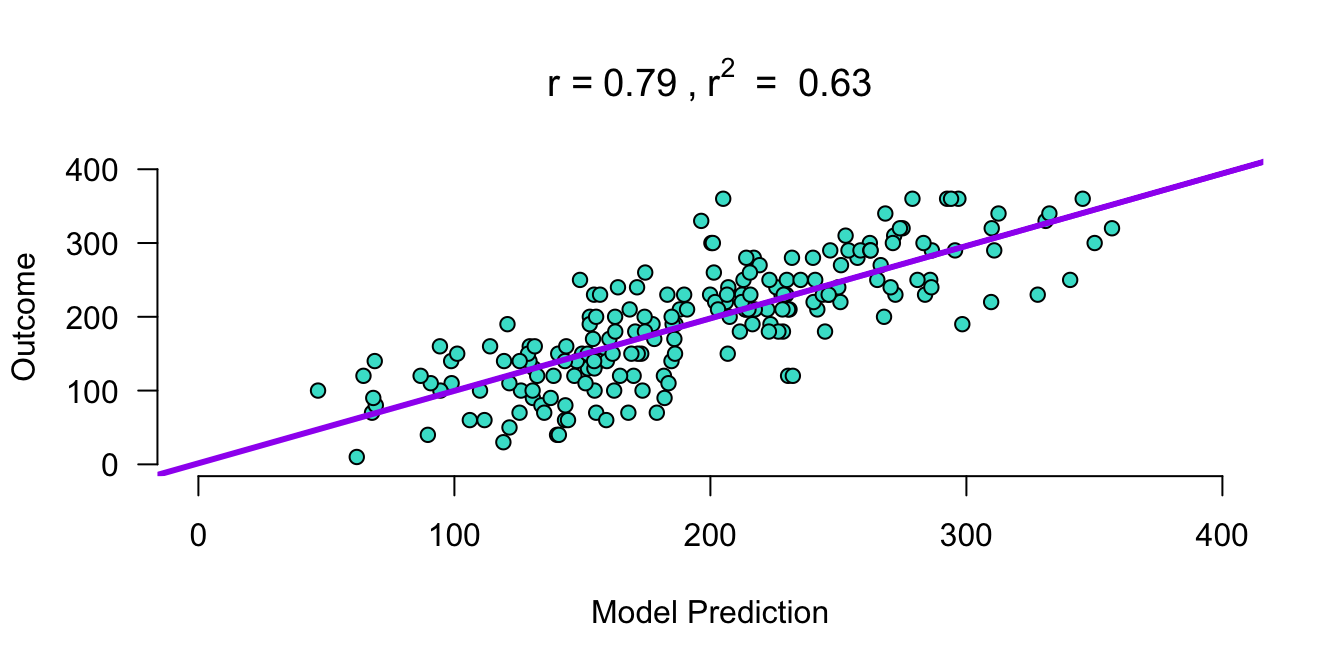
Outcome vs Model Prediction
Applet
Assumptions
A selection from Field (8.3 Bias in linear models):
For simple regression
- Sensitivity
- Homoscedasticity
- See here for further illustration
- Linearity
- Normality
Additionally, for multiple regression
- Multicollinearity (Section 8.9)
Multicollinearity
To adhere to the multicollinearity assumption, there must not be a too high linear relation between the predictor variables (main effects, not interaction terms).
This can be assessed through:
- Correlations
- Matrix scatterplot
- Collinearity diagnostics
- VIF: max < 10, mean not substantially > 1
- Tolerance (\(= \frac{1}{VIF}\)): min > 0.1

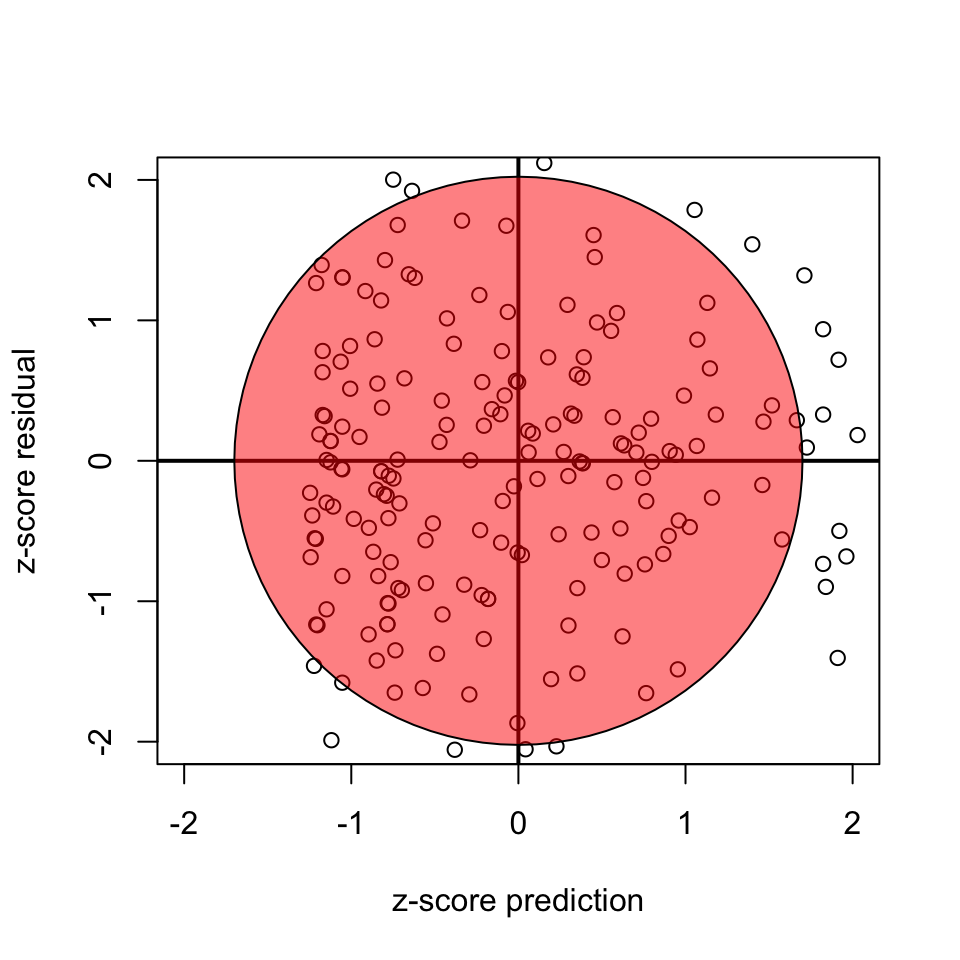
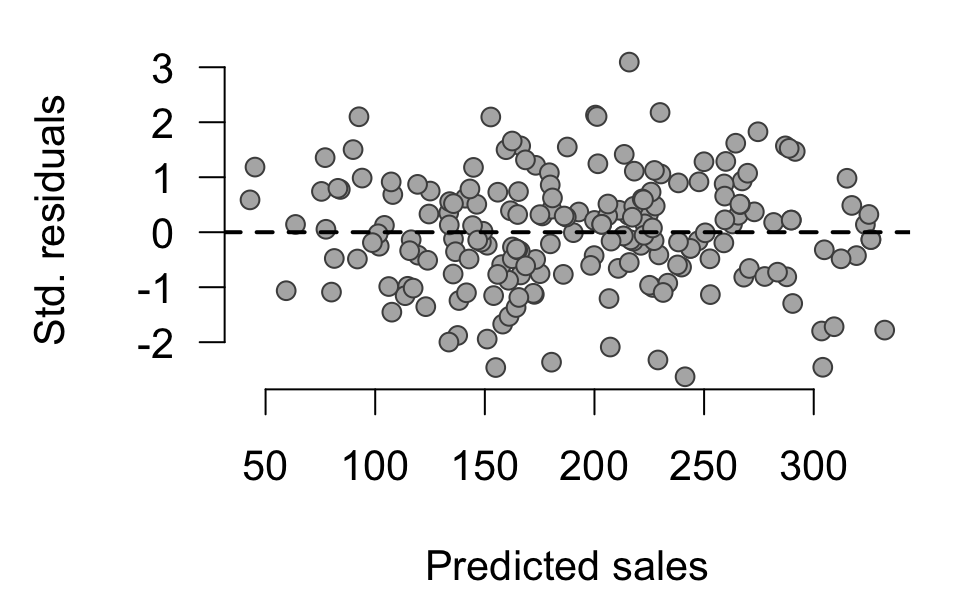
Homoscedasticity
- Variance of residuals should be equal across all expected values
- Look at scatterplot of residuals vs. predicted values. Ideally it’s an uncorrelated, round cloud
- For examples of violations, see here
- After the analysis is complete because it’s based on the residuals
Linearity
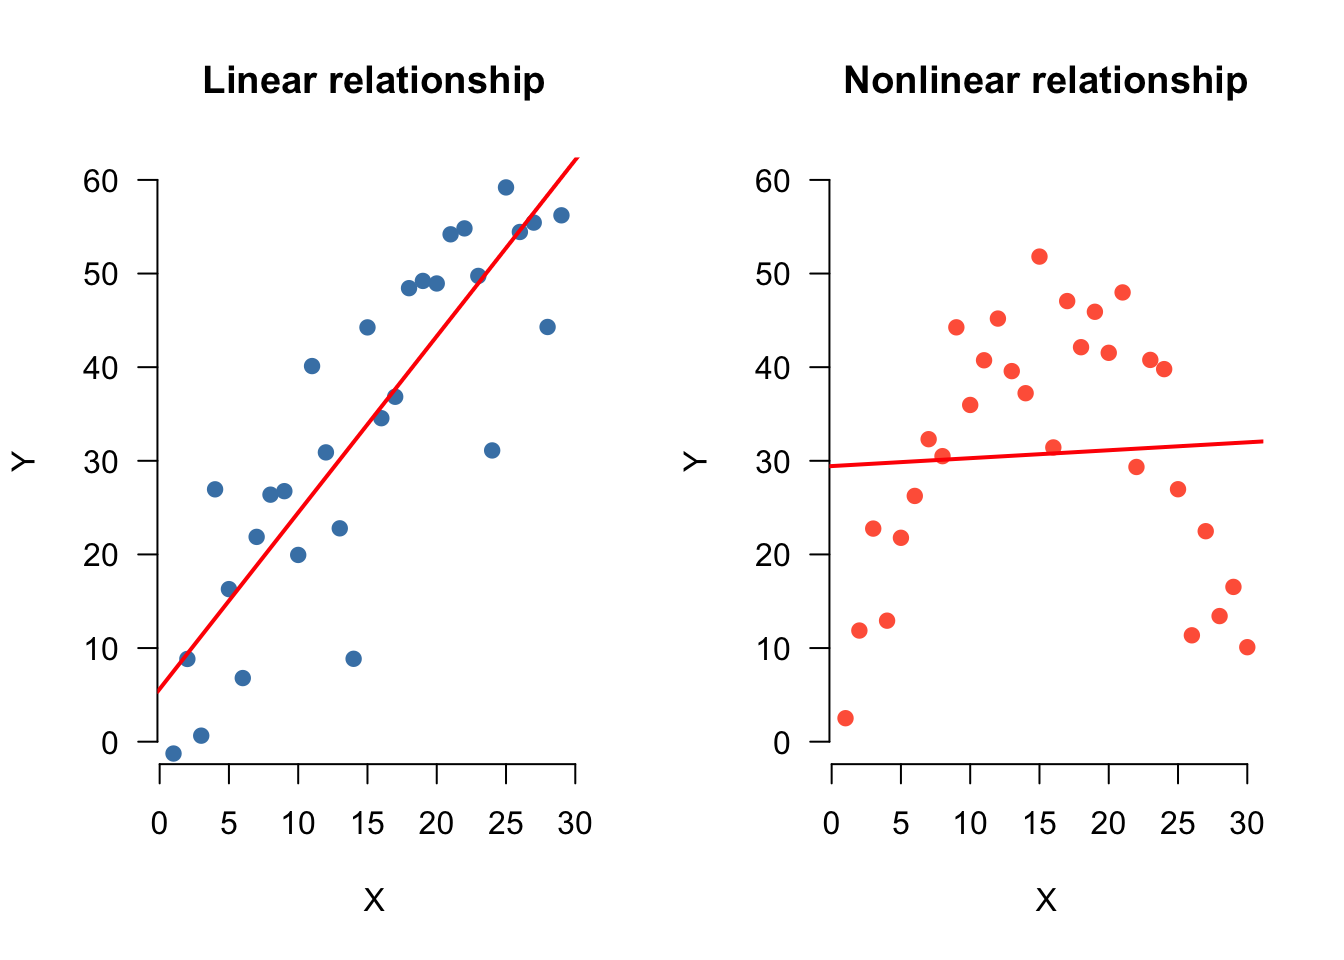
For the linearity assumption to hold, the predictors must have a linear relation to the outcome variable.
This can be checked through:
- Correlations
- Matrix scatterplot with predictors and outcome variable
Robust alternative: bootstrap
- Assumptions in doubt? Confidence intervals and \(p\)-values may be off
- Bootstrap the coefficients (Section 8.12)
- Statistics → Coefficients → From 5000 bootstraps
- Output: Bootstrap Coefficients table
- More robust methods (e.g., winsorizing, Section 6.10.7)
- Robust Statistics module (WRS2)
- Not exam material
Example
Predict album sales (1,000 copies) based on airplay (no. plays) and adverts ($1,000).
Read data
Regression model
Predict album sales based on airplay and adverts.
\[{sales}_i = b_0 + b_1 {airplay}_i + b_2 {adverts}_i + \epsilon_i\]
fit <- lm(sales ~ airplay + adverts, data = data)What is the model?
The beta coefficients are:
- \(b_0\) (intercept) = 41.12
- \(b_1\) = 3.59
- \(b_2\) = 0.09.
How to visualize??
- When we plot 1 predictors + DV, we plot in 2 dimensions, and we summarize the relationship by a line
- When we plot 2 predictors + DV, we plot in 3 dimensions, and we summarize the relationship by a plane
- … ???
Visual
What are the predicted values based on this model
\(\widehat{\text{album sales}} = b_0 + b_1 \text{airplay} + b_2 \text{adverts}\)
predicted.sales <- b.0 + b.1 * airplay + b.2 * adverts\(\text{model prediction} = \widehat{\text{album sales}}\)
Apply regression model
\(\widehat{\text{album sales}} = b_0 + b_1 \text{airplay} + b_2 \text{adverts}\)
\(\widehat{\text{album sales}} = 41.12 + 3.59 \times \text{airplay} + 0.09 \times \text{adverts} = 196.413\)
How far are we off?
error <- sales - predicted.salesOutcome = Model Prediction + Error
Is that true?
sales == predicted.sales + error [1] TRUE TRUE TRUE TRUE TRUE TRUE TRUE TRUE TRUE TRUE TRUE TRUE TRUE TRUE TRUE
[16] TRUE TRUE TRUE TRUE TRUE TRUE TRUE TRUE TRUE TRUE TRUE TRUE TRUE TRUE TRUE
[31] TRUE TRUE TRUE TRUE TRUE TRUE TRUE TRUE TRUE TRUE TRUE TRUE TRUE TRUE TRUE
[46] TRUE TRUE TRUE TRUE TRUE TRUE TRUE TRUE TRUE TRUE TRUE TRUE TRUE TRUE TRUE
[61] TRUE TRUE TRUE TRUE TRUE TRUE TRUE TRUE TRUE TRUE TRUE TRUE TRUE TRUE TRUE
[76] TRUE TRUE TRUE TRUE TRUE TRUE TRUE TRUE TRUE TRUE TRUE TRUE TRUE TRUE TRUE
[91] TRUE TRUE TRUE TRUE TRUE TRUE TRUE TRUE TRUE TRUE TRUE TRUE TRUE TRUE TRUE
[106] TRUE TRUE TRUE TRUE TRUE TRUE TRUE TRUE TRUE TRUE TRUE TRUE TRUE TRUE TRUE
[121] TRUE TRUE TRUE TRUE TRUE TRUE TRUE TRUE TRUE TRUE TRUE TRUE TRUE TRUE TRUE
[136] TRUE TRUE TRUE TRUE TRUE TRUE TRUE TRUE TRUE TRUE TRUE TRUE TRUE TRUE TRUE
[151] TRUE TRUE TRUE TRUE TRUE TRUE TRUE TRUE TRUE TRUE TRUE TRUE TRUE TRUE TRUE
[166] TRUE TRUE TRUE TRUE TRUE TRUE TRUE TRUE TRUE TRUE TRUE TRUE TRUE TRUE TRUE
[181] TRUE TRUE TRUE TRUE TRUE TRUE TRUE TRUE TRUE TRUE TRUE TRUE TRUE TRUE TRUE
[196] TRUE TRUE TRUE TRUE TRUE
- Yes!
Visual (subset of 10 albums)
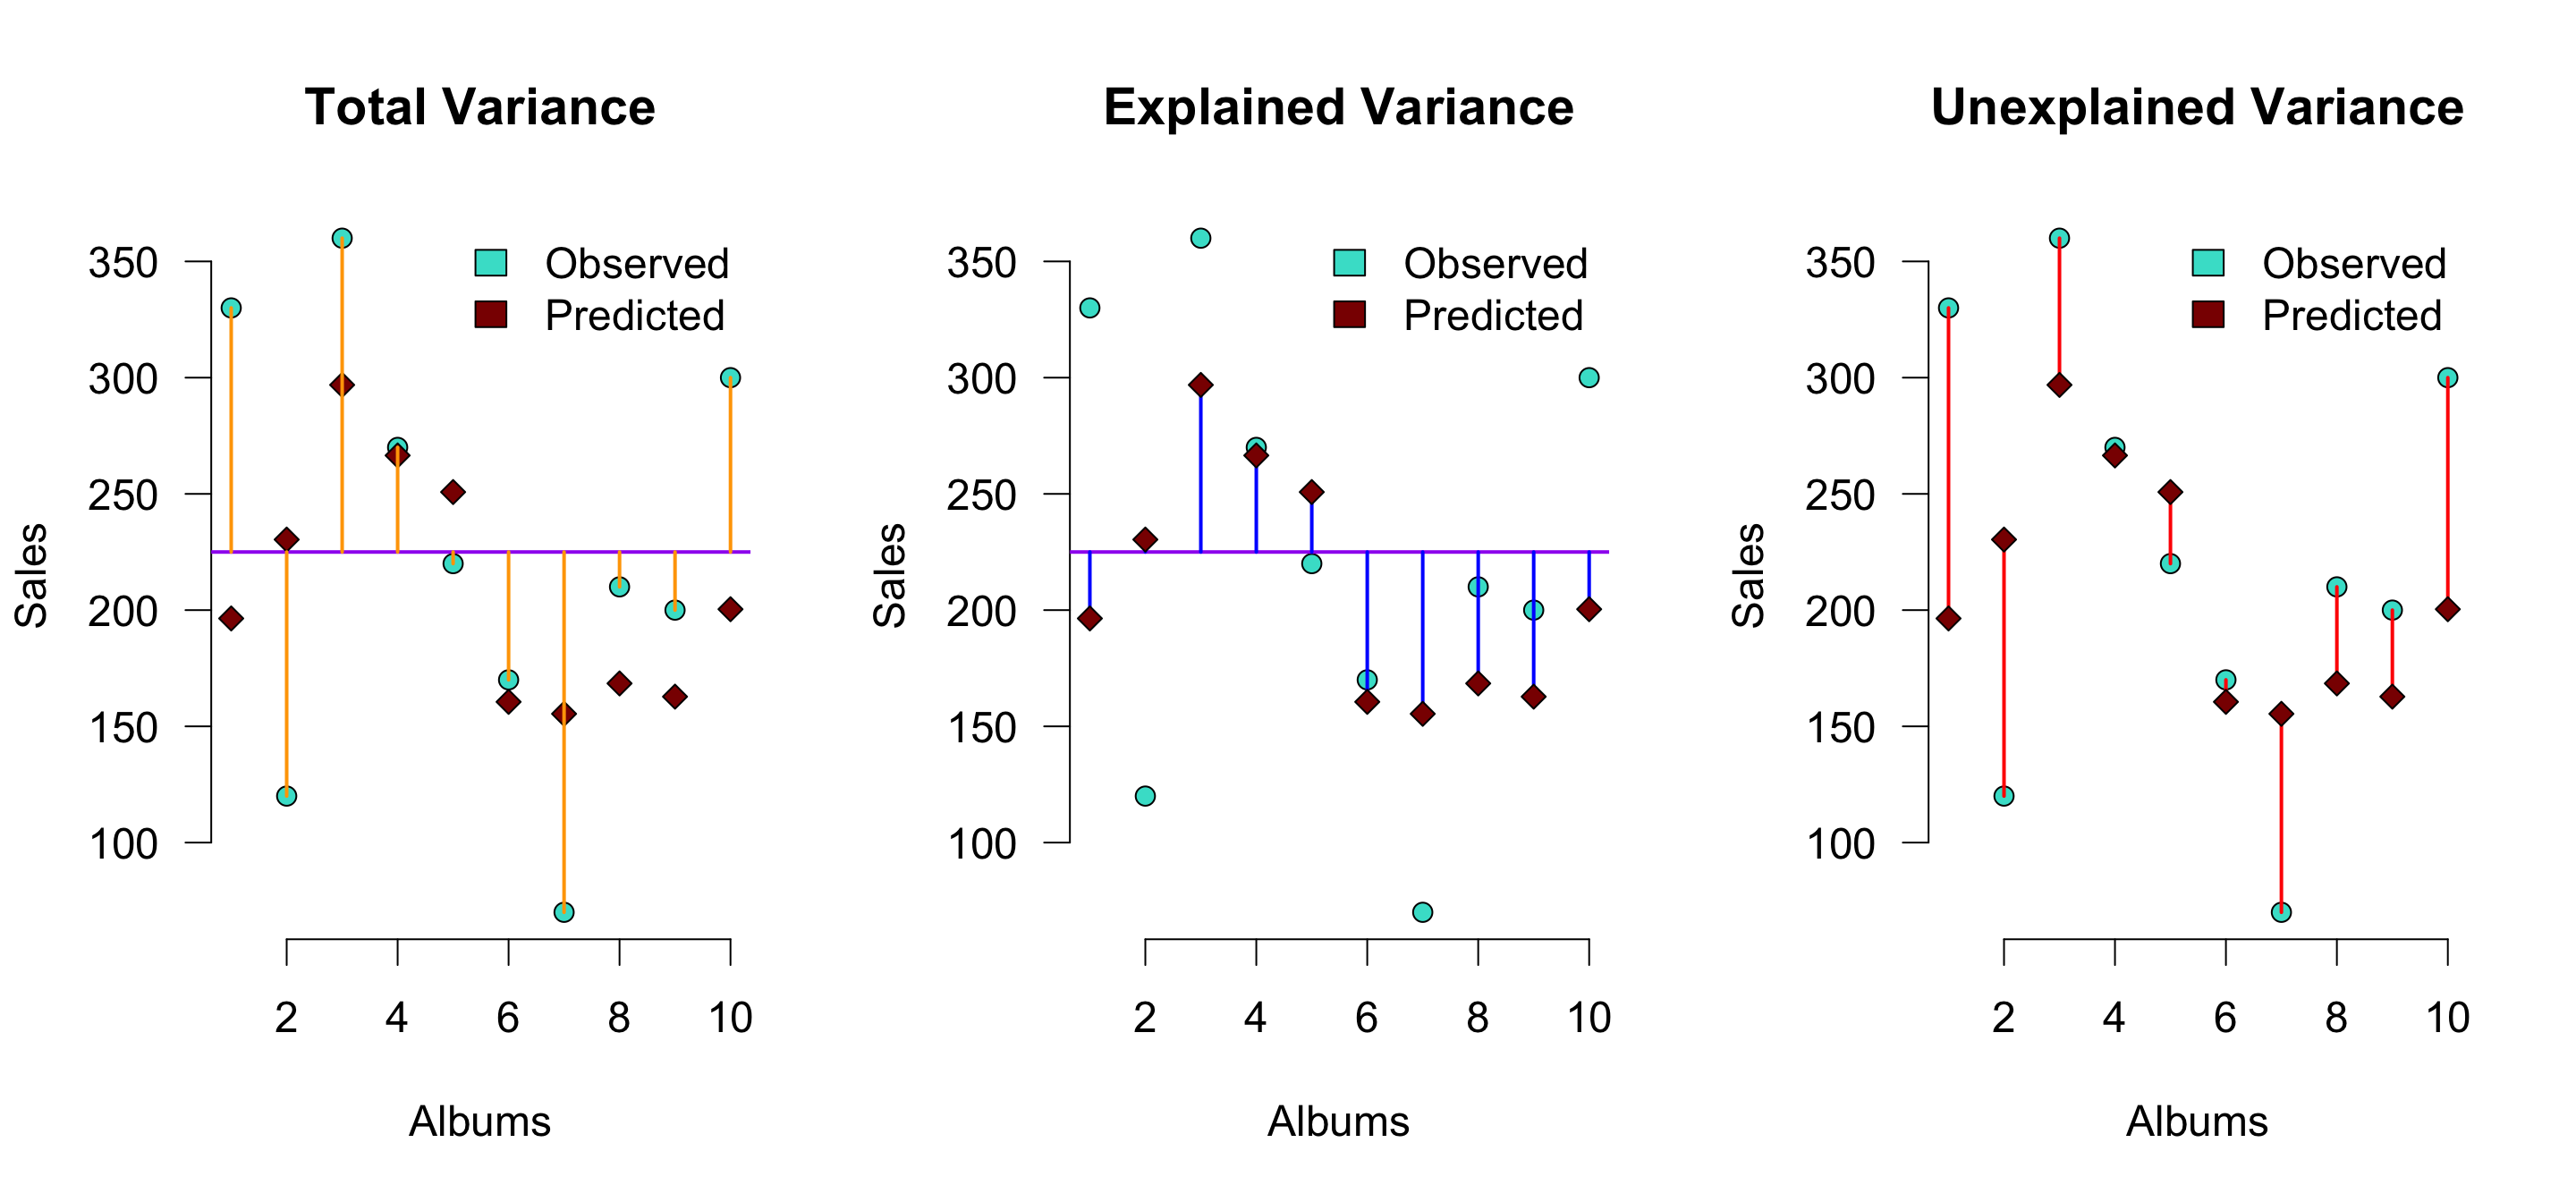
\(r^2\) is the proportion of blue to orange, while \(1 - r^2\) is the proportion of red to orange
Explained variance
The explained variance is the deviation of the estimated model outcome compared to the grand mean.
To get a percentage of explained variance, it must be compared to the total variance. In terms of squares:
\(\frac{{SS}_{model}}{{SS}_{total}}\)
We also call this: \(r^2\) or \(R^2\).
Why?
r <- cor(sales, predicted.sales)
r^2
[1] 0.62913Explained variance
Hierarchical regression
Isolating individual contributions
- What does a predictor add on top of the others?
- Enter predictors in steps, known ones first (past research)
- \(R^2\) change is the extra variance the new predictors explain
- \(F\) change tests whether that increase is more than chance
\[F_{change} = \frac{(N - k_{new} - 1)\, R^2_{change}}{k_{change}\, (1 - R^2_{new})}\]
- Album sales (Section 8.10), adding airplay and image to adverts
- \(R^2\) goes from 0.335 to 0.665, \(F\)(2, 196) = 96.447, \(p\) < .001
- How to in JASP
Model summary
| Model | R2 | Adjusted R2 | R2 change | F change | df1 | df2 | p |
|---|---|---|---|---|---|---|---|
| M0 | 0.000 | 0.000 | 0.000 | 0 | 199 | ||
| M1 | 0.335 | 0.331 | 0.335 | 99.587 | 1 | 198 | < .001 |
| M2 | 0.665 | 0.660 | 0.330 | 96.447 | 2 | 196 | < .001 |
- \(M_1\) includes adverts; \(M_2\) includes adverts, airplay and image
Checking the assumptions
Where to check each assumption in JASP (final model)
| Assumption | In JASP | Looks fine when |
|---|---|---|
| Multicollinearity | Statistics → Coefficients → Tolerance and VIF | all VIFs below 10, average close to 1 |
| Linearity, equal variances | Plots → Residuals vs. predicted | a random cloud around 0 |
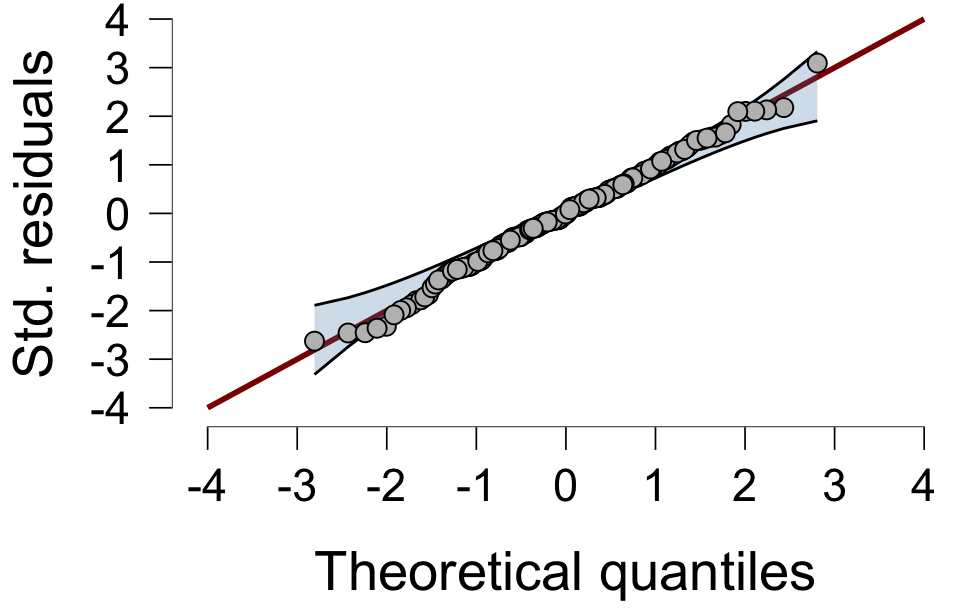
| Normality of the residuals | Plots → Q-Q plot standardized residuals → Confidence interval | points close to the line, mostly within the band |
| Outliers, influential cases | Statistics → Residuals → Casewise diagnostics | about 5% of std. residuals beyond \(\pm 2\) at most, Cook’s distance below 1 |
Residuals of the final model
Residuals vs. predicted
Q-Q plot standardized residuals
- Left plot shows a random cloud around 0, so linearity and equal variances look fine
- Right plot shows points close to the line, so the residuals look normal
JASP

Closing
Recap
- In linear regression, we can build multiple models and look at the increase in model fit
- Just as in ANOVA, when we have multiple predictors we look out for:
- Dependence between predictors
- Interaction effects
Next Time
- Mediation analysis (lecture 22)
Recommended Exercises
Labcoat Leni 8.1
Ong et al. (2011): I want to be loved (on Facebook)
Does narcissism predict Facebook behavior, over and above age, sex, grade and extraversion?
statusandprofile: status updates per week, profile picture rating (one model each)- Block 1:
age,sex,grade; block 2:extraversion; block 3:narcissism
Labcoat Leni 8.2
Chamorro-Premuzic et al. (2008): Why do you like your lecturers?
Do students’ own traits predict what they want in a lecturer, over and above age and sex?
lec_*: five traits wanted in a lecturer (one model each)- Block 1:
age,sex; block 2: own traits,stu_*
Contact
