26. Moderation
In this lecture we aim to:
- Look at interactions between continuous predictors
- Revisit the Process module
- Demonstrate in JASP
Reading: Chapter 10 (§10.1–10.3)
Moderation
Moderation
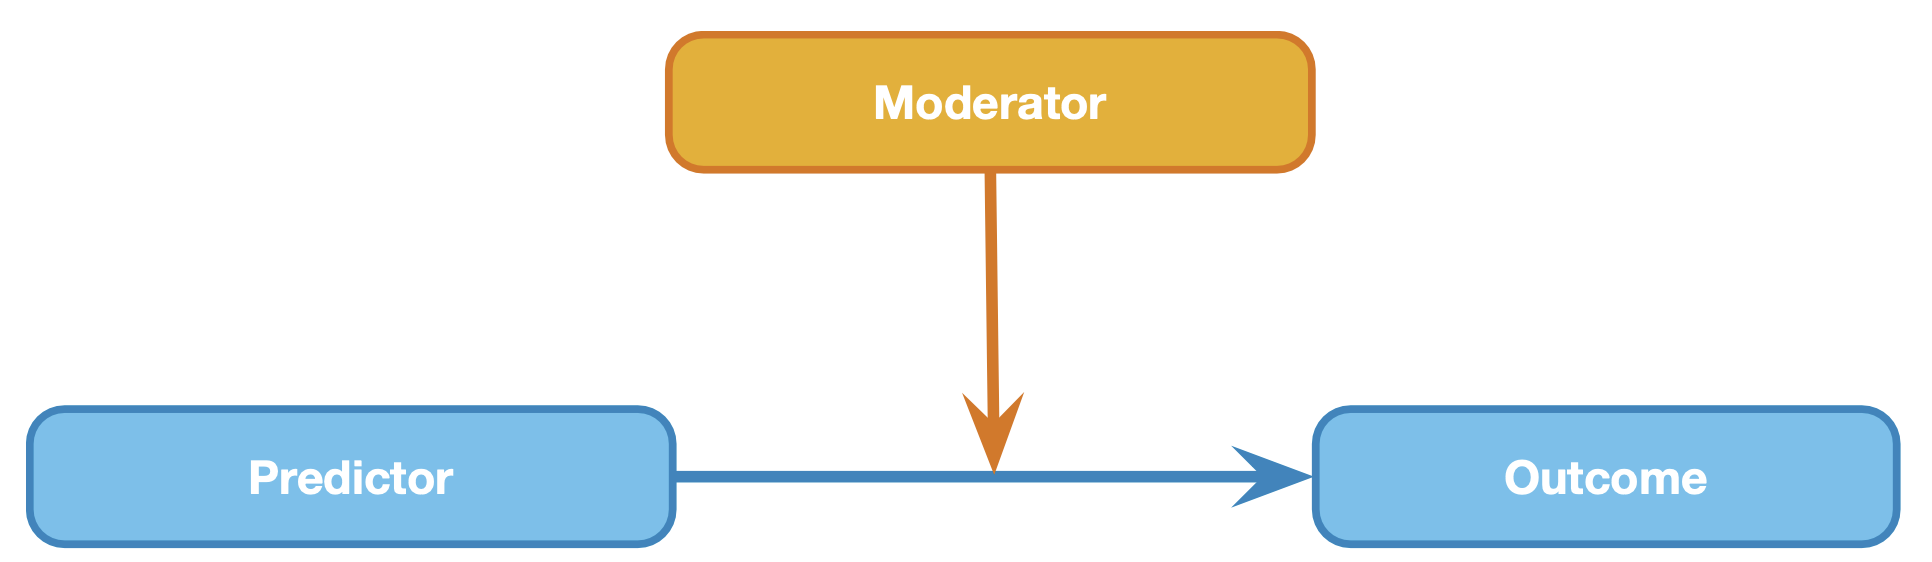
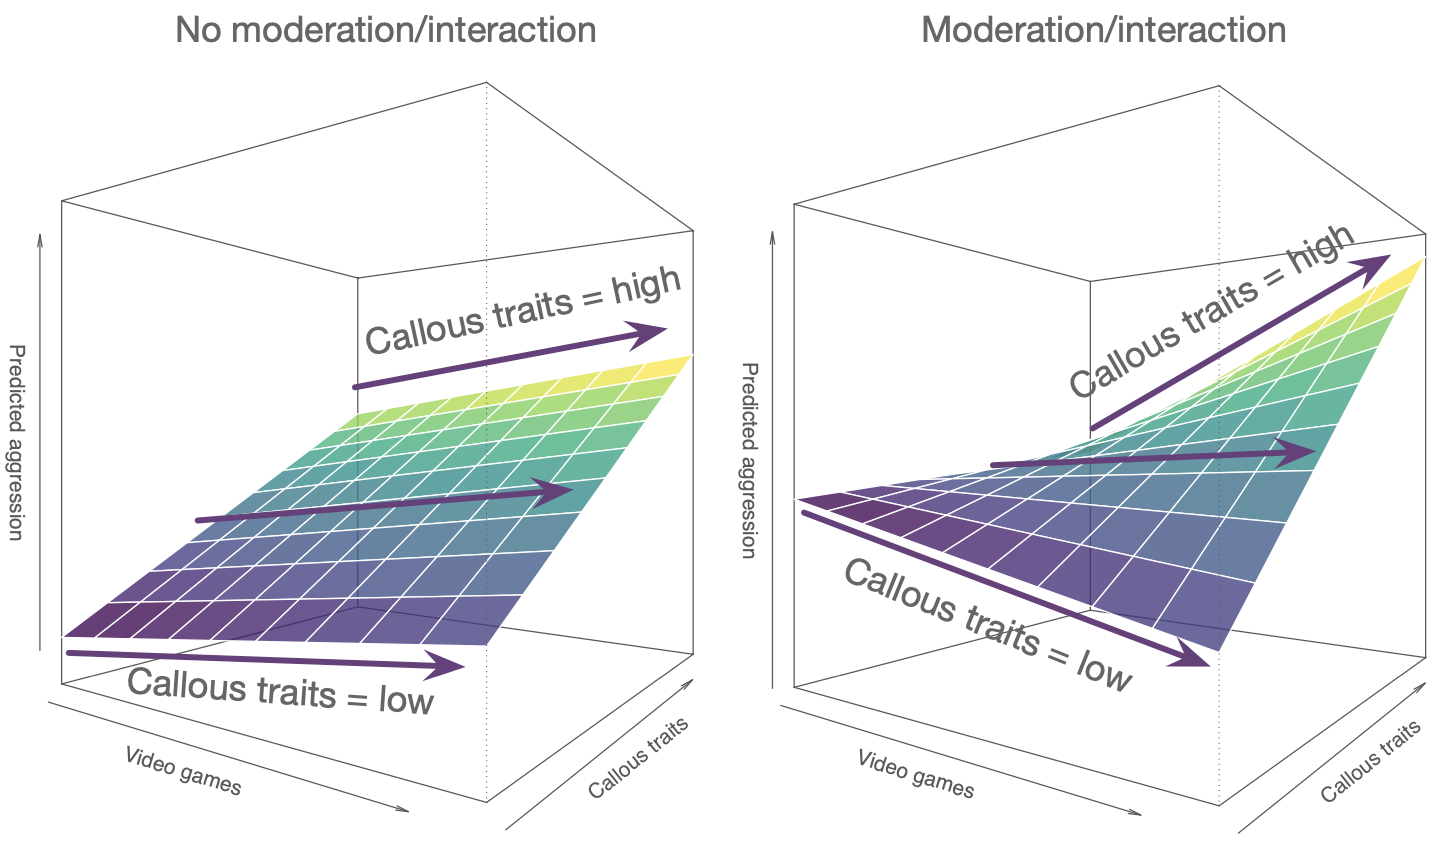
In statistics and regression analysis, moderation occurs when the relationship between two variables depends on a third variable. The third variable is referred to as the moderator variable or simply the moderator. The effect of a moderating variable is characterized statistically as an interaction.
Source WIKIPEDIA
Model
\(\definecolor{red}{RGB}{255,0,0} \definecolor{black}{RGB}{0,0,0} \color{black}Out_i = b_0 + b_1 Pred_i + b_2 Mod_i + \color{red}b_3 Pred_i \times Mod_i \color{black}+ \epsilon_i\)
Model
Assumptions
A selection from Field (8.3 Bias in linear models):
For simple regression
- Sensitivity
- Homoscedasticity
- See here for further illustration
- Linearity
- Normality
Additionally, for multiple regression
- Multicollinearity (Section 8.9)
View data
Model
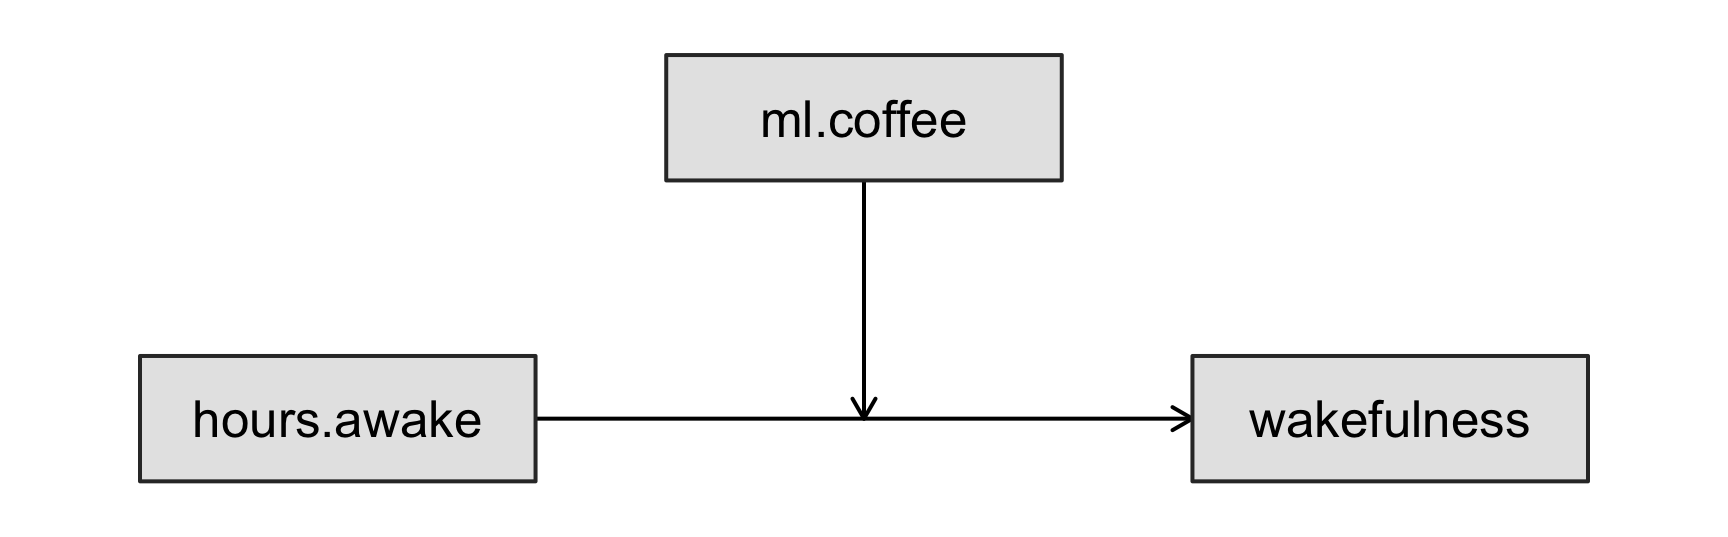
\[\definecolor{red}{RGB}{255,0,0} \definecolor{black}{RGB}{0,0,0} \begin{aligned} \color{black}\text{wakefulness}_i = {} & b_0 + b_1\,\text{hours.awake}_i + b_2\,\text{ml.coffee}_i \\ & + \color{red}b_3\,\text{hours.awake}_i \times \text{ml.coffee}_i \color{black}+ \epsilon_i \end{aligned}\]
Correlations
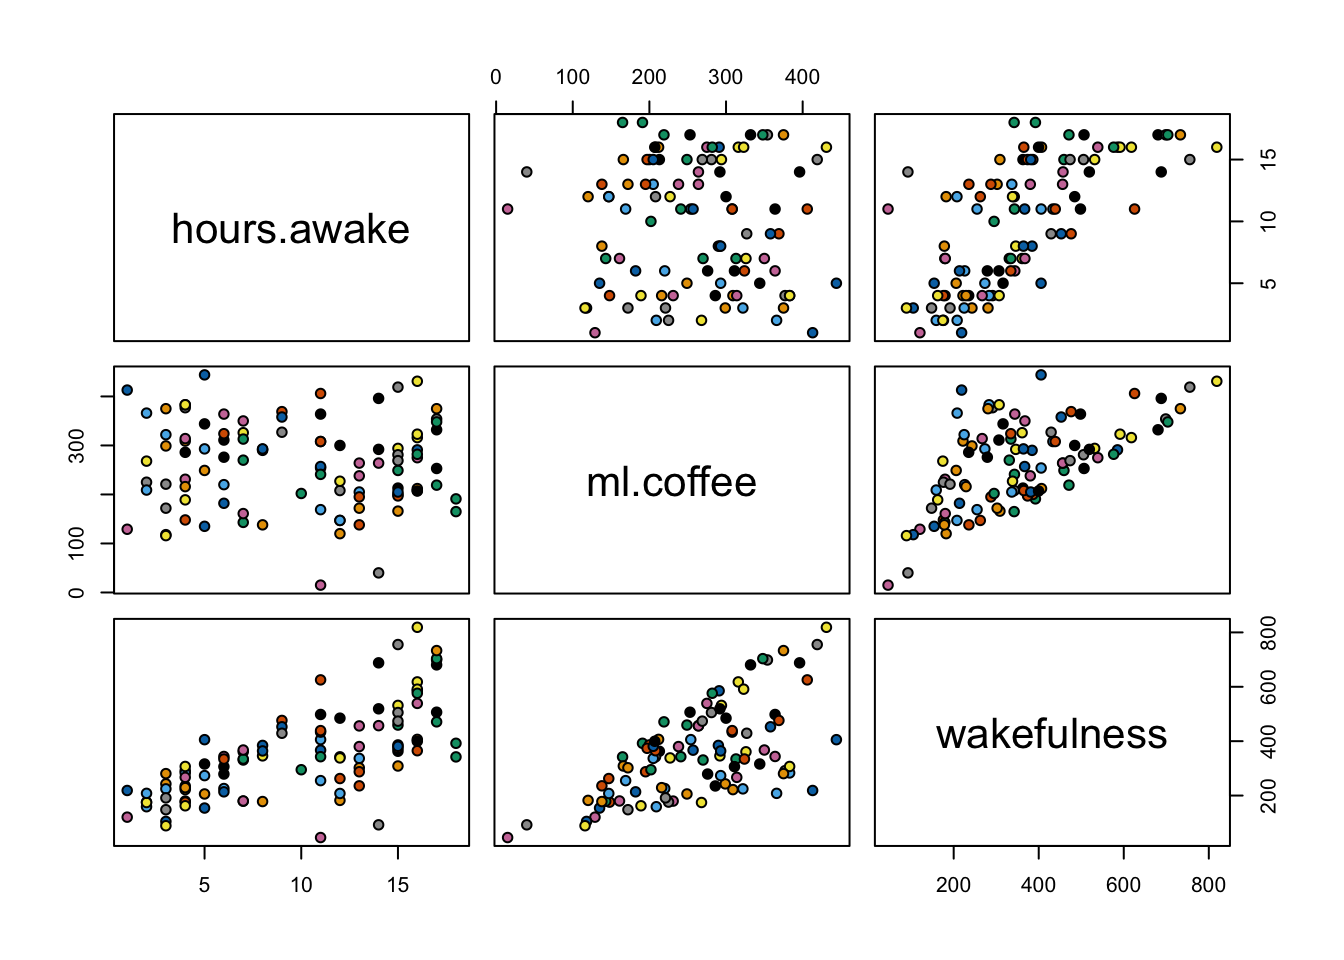
cor(data) hours.awake ml.coffee wakefulness
hours.awake 1.00000000 -0.05495344 0.6935663
ml.coffee -0.05495344 1.00000000 0.6175888
wakefulness 0.69356633 0.61758884 1.0000000Scatterplots
3D plot
Take it for a spin
Descriptives plot
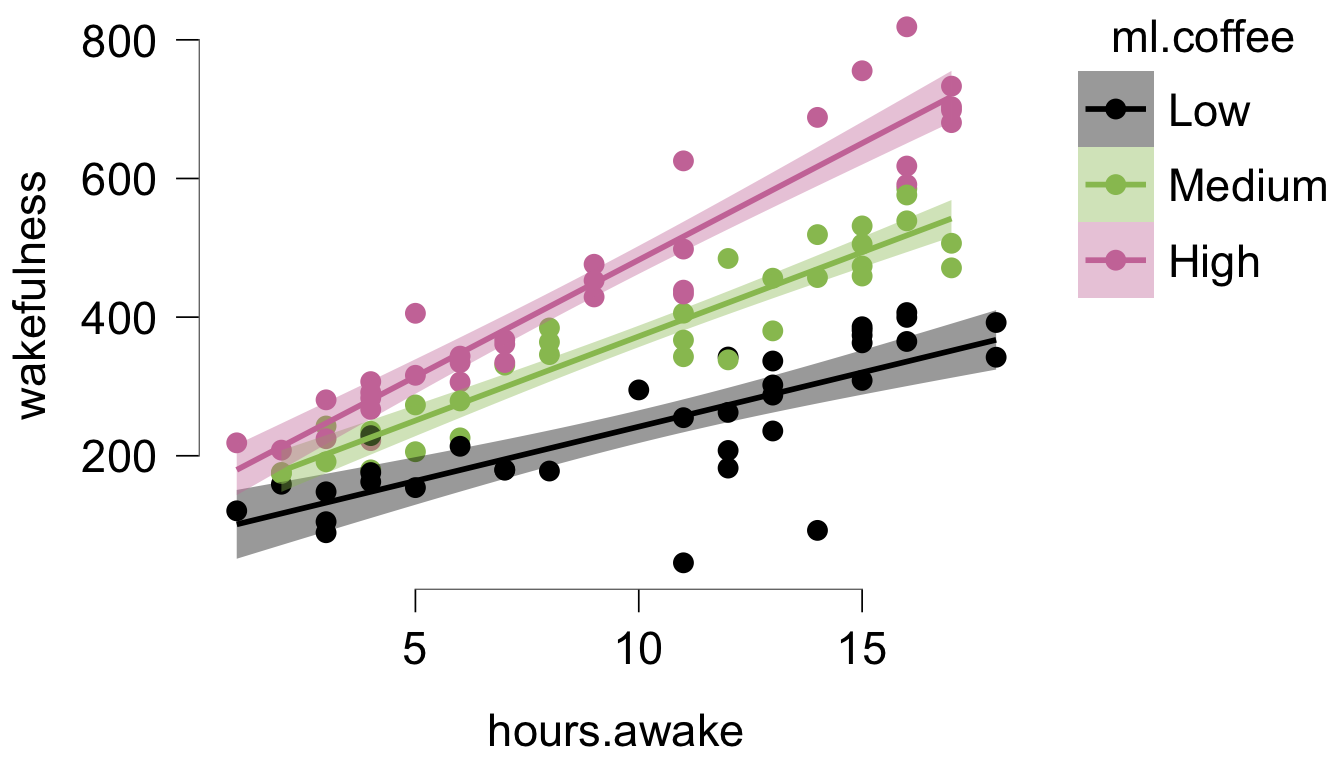
Coffee groups
## Where JASP's descriptives plot splits ml.coffee (default, 3 groups)
round(mean(ml.coffee) + c(-0.5, 0.5) * sd(ml.coffee), 1)
[1] 216.0 303.8Fit model
fit <- lm(wakefulness ~ hours.awake + ml.coffee + hours.awake*ml.coffee); summary(fit)$coefficients Estimate Std. Error t value Pr(>|t|)
(Intercept) 61.6830508 12.103218305 5.096417 1.732742e-06
hours.awake -3.6115498 1.123005892 -3.215967 1.772112e-03
ml.coffee 0.2656631 0.042872680 6.196560 1.437213e-08
hours.awake:ml.coffee 0.1024289 0.004037037 25.372290 2.355332e-44Regression equation
\(\definecolor{red}{RGB}{255,0,0} \definecolor{black}{RGB}{0,0,0} \color{black}\widehat{Out_i} = b_0 + b_1 Pred_i + b_2 Mod_i + \color{red}b_3 Pred_i \times Mod_i \color{black}\)
\(\definecolor{red}{RGB}{255,0,0} \definecolor{black}{RGB}{0,0,0} \color{black}\widehat{Out_i} = 61.68 + -3.61 \times Pred_i + 0.27 \times Mod_i + \color{red} 0.1 \times Pred_i \times Mod_i \color{black}\)
\(\definecolor{red}{RGB}{255,0,0} \definecolor{black}{RGB}{0,0,0} \color{black}\widehat{Out_i} = 61.68 + -3.61 \times 15 + 0.27 \times 213 + \color{red} 0.1 \times 15 \times 213 \color{black} \approx 391.36\)
Expected surface
Expected values
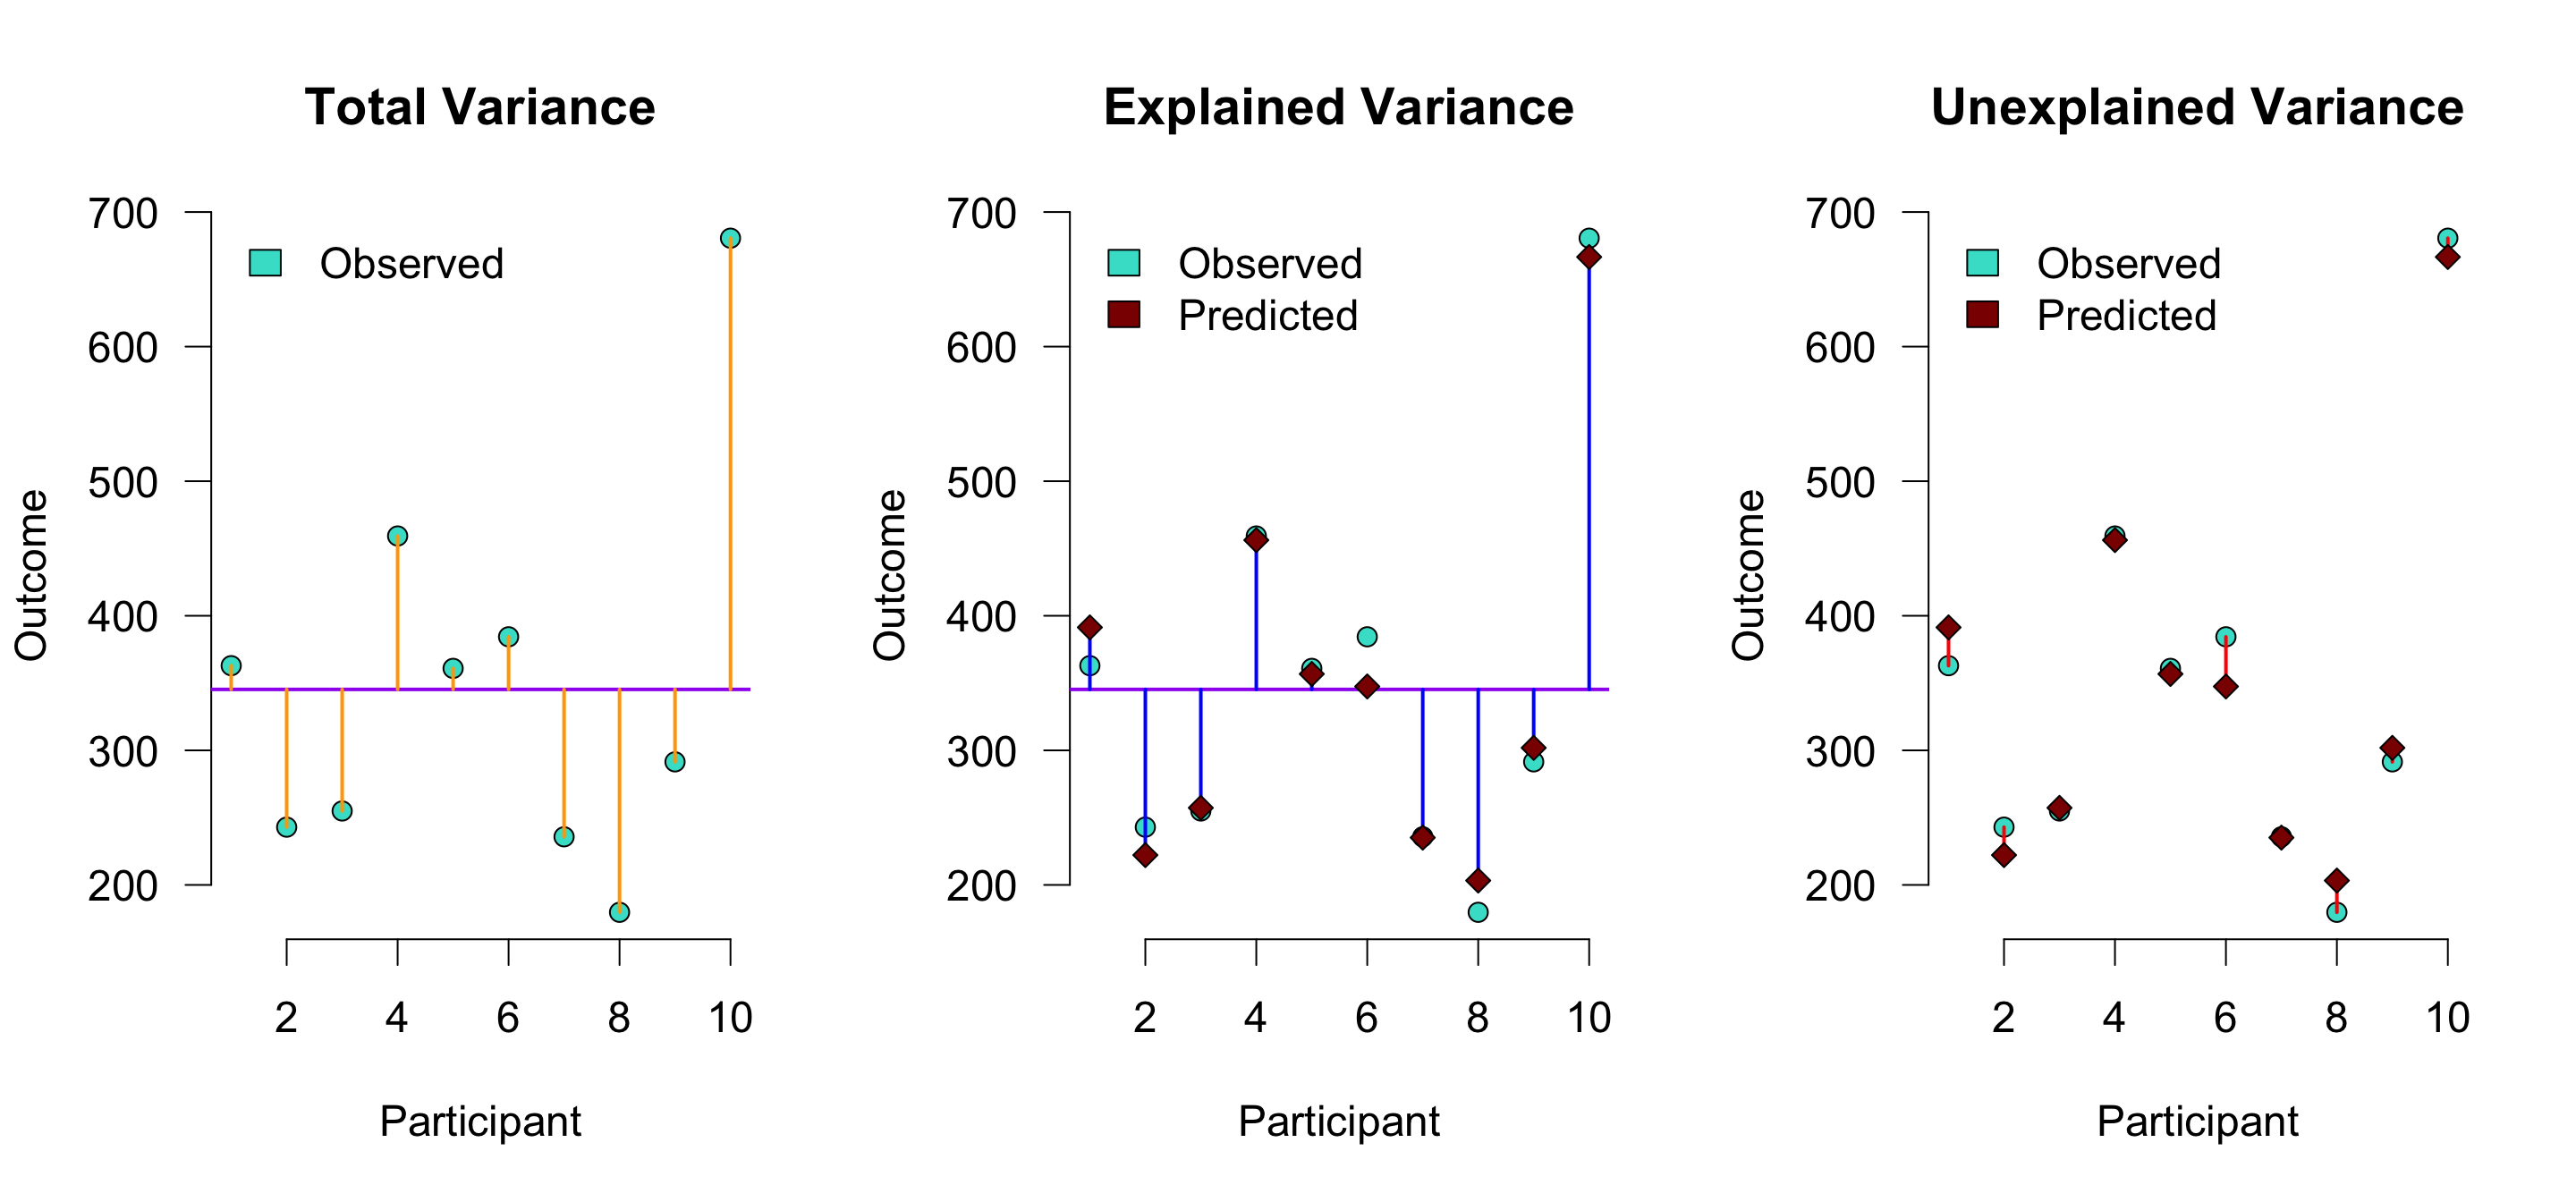
\(r^2\) is the proportion of blue to orange, while \(1 - r^2\) is the proportion of red to orange
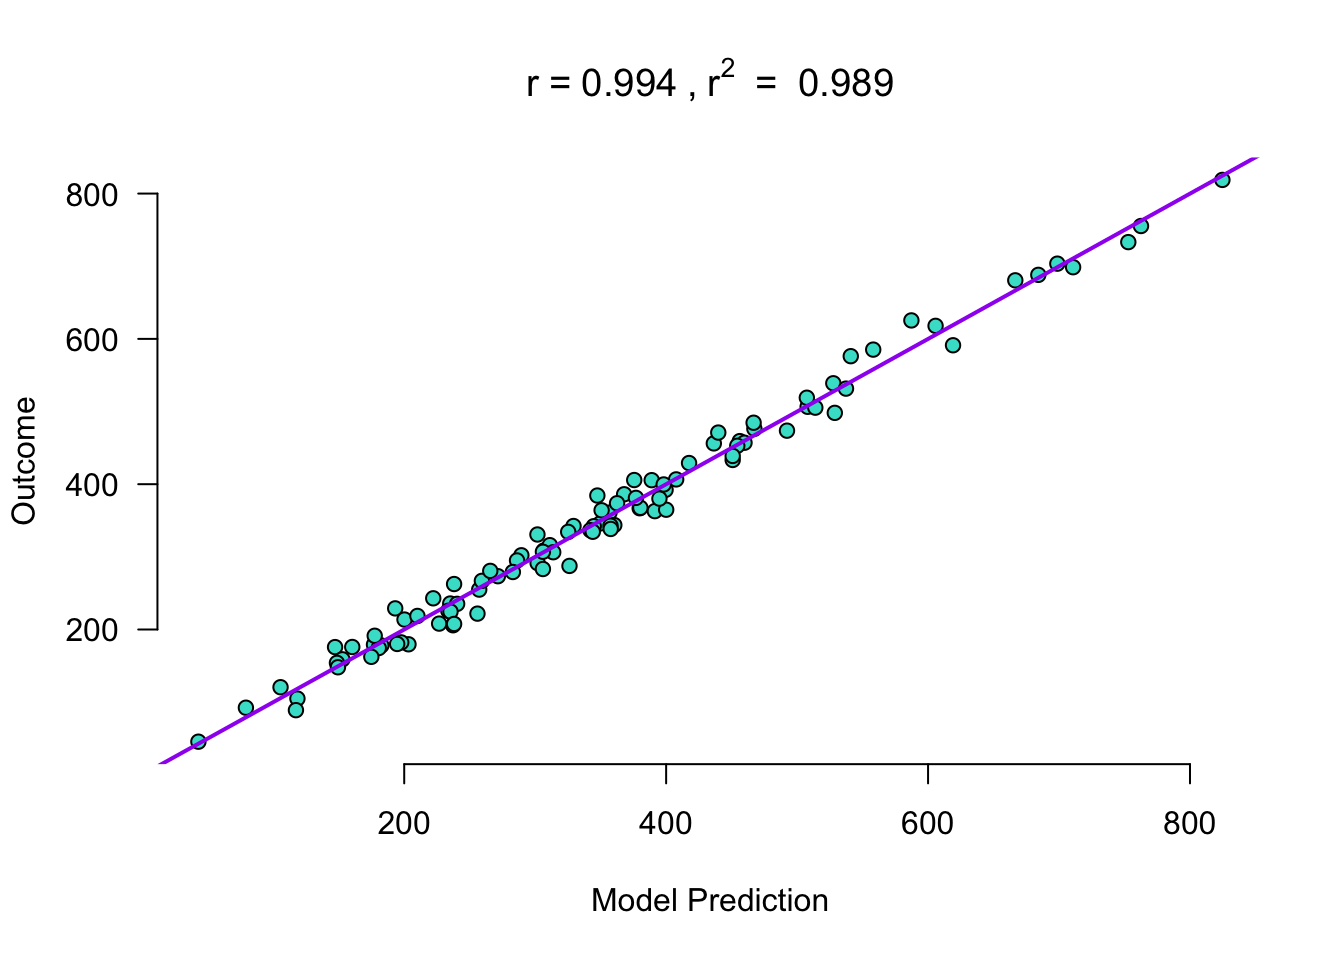
Expected vs. observed
Turn quantitative into ordinal?!
## Round to number of cups of coffee, always rounding down
data$cups.coffee <- data$ml.coffee %/% 150
Interaction in hierarchical regression
Does the interaction add anything?
| Model | R2 | Adjusted R2 | R2 change | F change | df1 | df2 | p |
|---|---|---|---|---|---|---|---|
| M0 | 0.000 | 0.000 | 0.000 | 0 | 99 | ||
| M1 | 0.912 | 0.910 | 0.912 | 504.412 | 2 | 97 | < .001 |
| M2 | 0.989 | 0.988 | 0.076 | 643.753 | 1 | 96 | < .001 |
Note. M1 includes hours.awake, ml.coffee
Note. M2 includes hours.awake, ml.coffee, hours.awake:ml.coffee
Centering
- With an interaction, \(b_1\) and \(b_2\) are effects when the other predictor is 0
- Grand mean centering subtracts the mean from every score, so 0 now means average
- Leaves \(b_3\) alone, but changes interpretation of \(b_1\) and \(b_2\)
| Not centered | Centered | |
|---|---|---|
| \(b_1\) (hours.awake) | -3.612, at 0 ml coffee | 23.013, at the mean (260 ml) |
| \(b_2\) (ml.coffee) | 0.266, at 0 hours awake | 1.269, at the mean (9.8 hours) |
| \(b_3\) (interaction) | 0.102 | 0.102 |
- Impact of centering grows as the interaction effect grows
Process module or linear regression?
| Linear regression | Process module | |
|---|---|---|
| \(b_3\) (interaction) | 0.102 | 0.102 |
| \(b_1\), \(b_2\) | -3.612, 0.266 (not centered) | 23.013, 1.269 (centered by default) |
| Test | \(t\) | \(z\), SEs slightly smaller (\(\times\) 0.98 here) |
| Also gives | \(R^2\) change, assumption checks | Simple slopes |
- Same estimates after unticking Mean-centered moderation in Process
JASP

Closing
Recap
- Interactions still matter with continuous predictors
- Continuous interactions can be assessed with:
- Linear regression
- Process module
Exam note
- Keep the default settings of each analysis, no need to center by hand
- Process module centers for you (Mean-centered moderation)
- Linear regression does not center
- So \(b_1\) and \(b_2\) differ between the two analyses
- Process gives the effect at the mean of the other predictor
- Linear regression gives the effect when the other predictor is 0
- The interaction \(b_3\) is the same in both
- Check the assumptions in Linear Regression, not in the Process module
- VIF in the model without the interaction
- Checking the assumptions (lecture 21)
Next Time
- Association between categorical variables: chi-squared test (lecture 28)
Recommended Exercises
Contact
