29. Bayesian ANOVA

Parameter estimation & hypothesis testing

Johnny van Doorn

University of Amsterdam

13 November 2026

In this lecture we aim to:

  • Repeat some core Bayesian concepts
  • Apply these to ANOVA
  • Show Bayesian ANOVA in JASP

Reading: A Brief Introduction to Bayesian Inference
(chapters 1–6 repeat RMS, chapter 7 on ANOVA is new)

Bayesian parameter estimation

Beer tasting

  • Can people taste the difference between alcoholic and non-alcoholic beer?
  • \(\theta\) is the probability of a correct identification

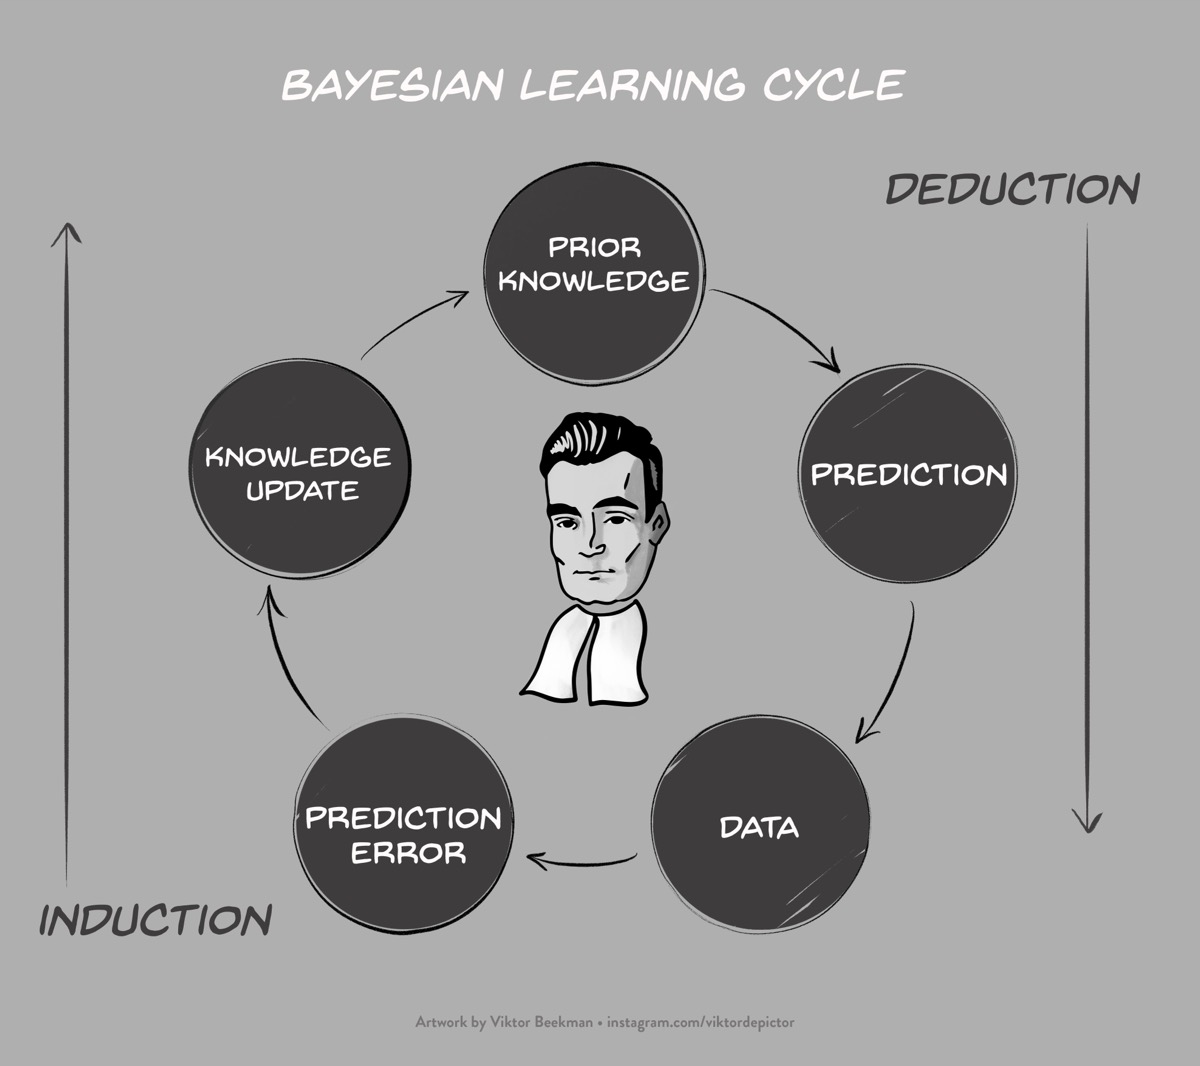
Bayesian updating

Bayesian learning cycle with prior knowledge, prediction, data, prediction error and knowledge update

Bayes’ rule for knowledge updating

\[\large \underbrace{P(\theta \mid data)}_{\text{Posterior beliefs}} = \underbrace{P(\theta)}_{\text{Prior beliefs}} \times \overbrace{\underbrace{\frac{P(data \mid \theta)}{P(data)}}_{\substack{\text{Average prediction} \\ \text{across all } \theta\text{'s}}}}^{\text{Prediction for specific } \theta}\]

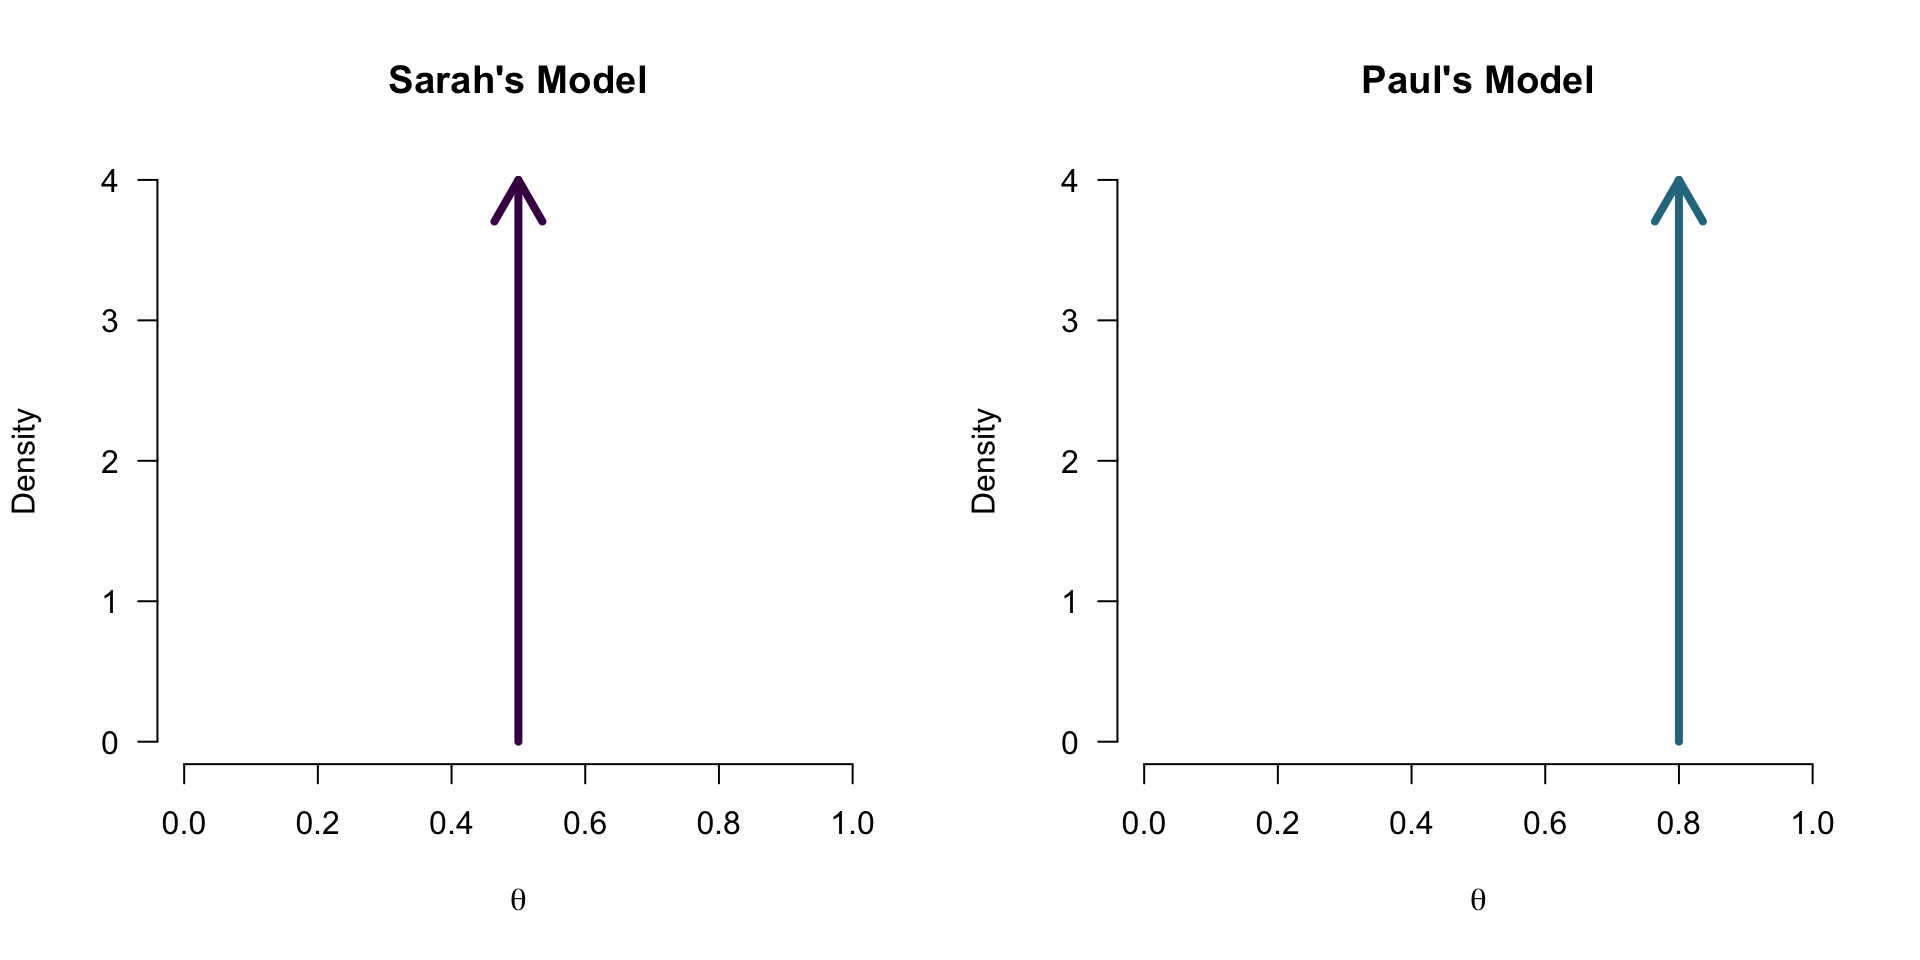
What is a model?

What does a model predict?
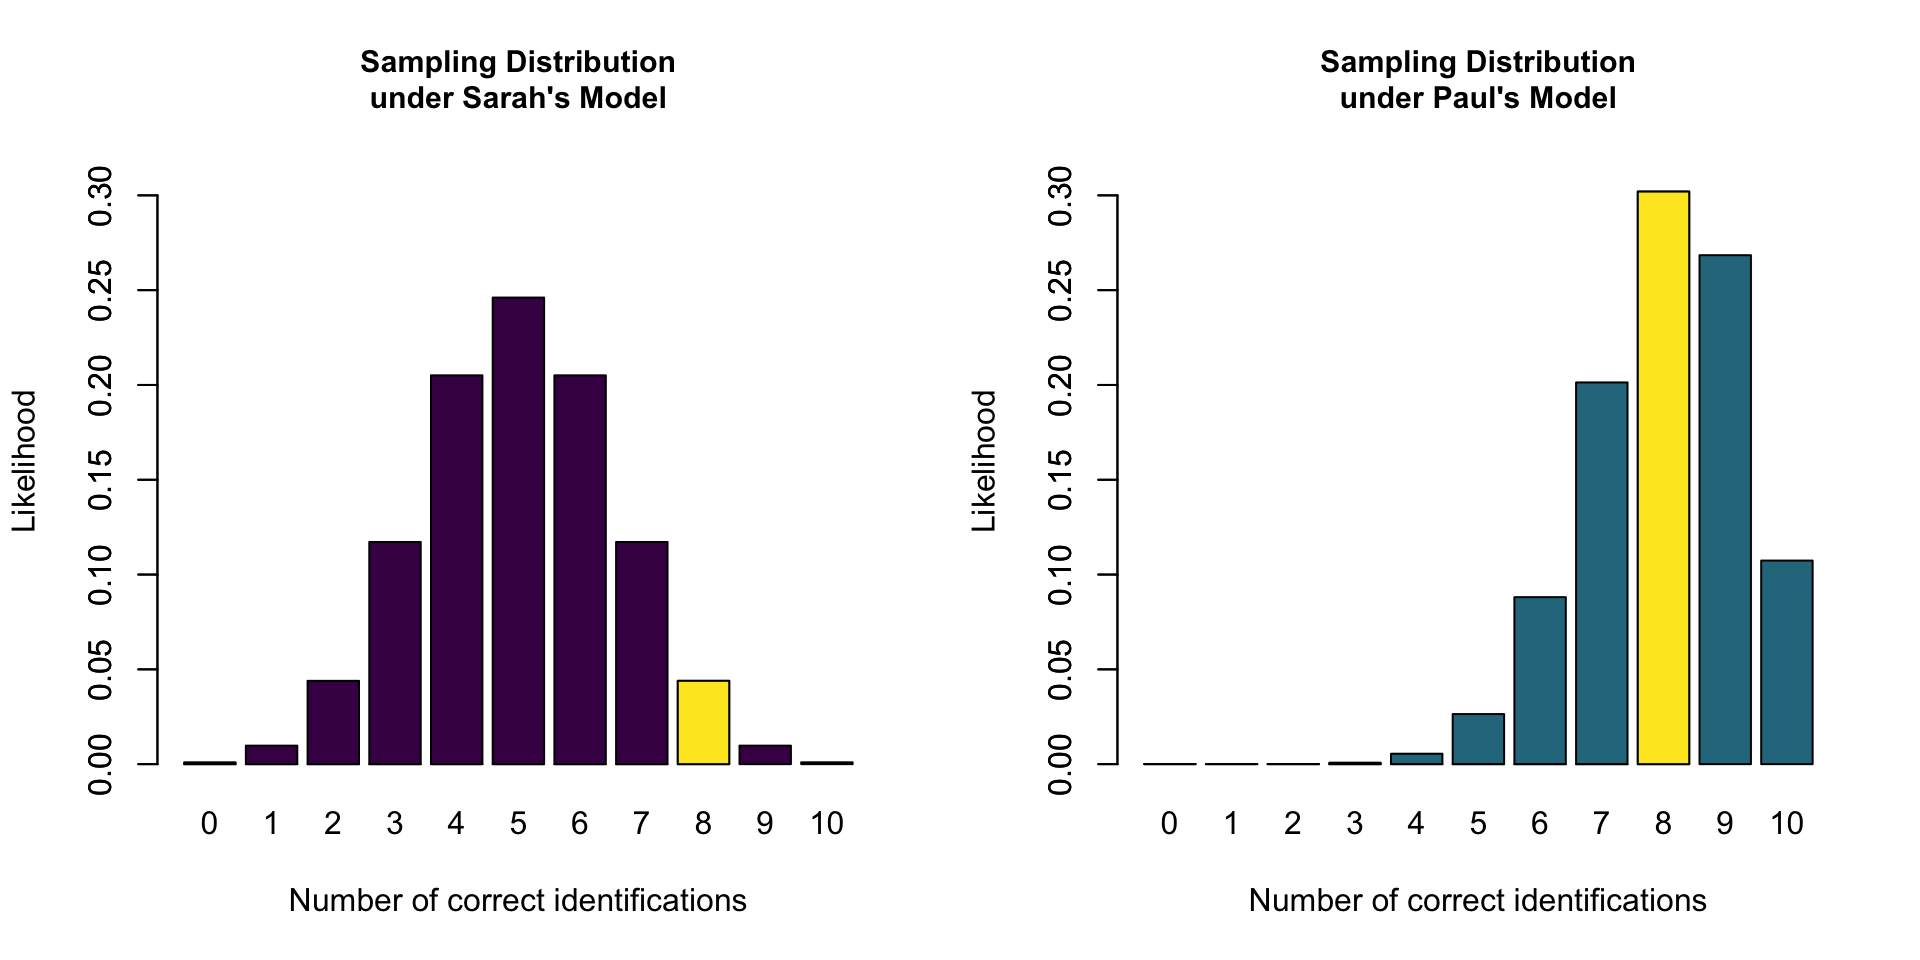
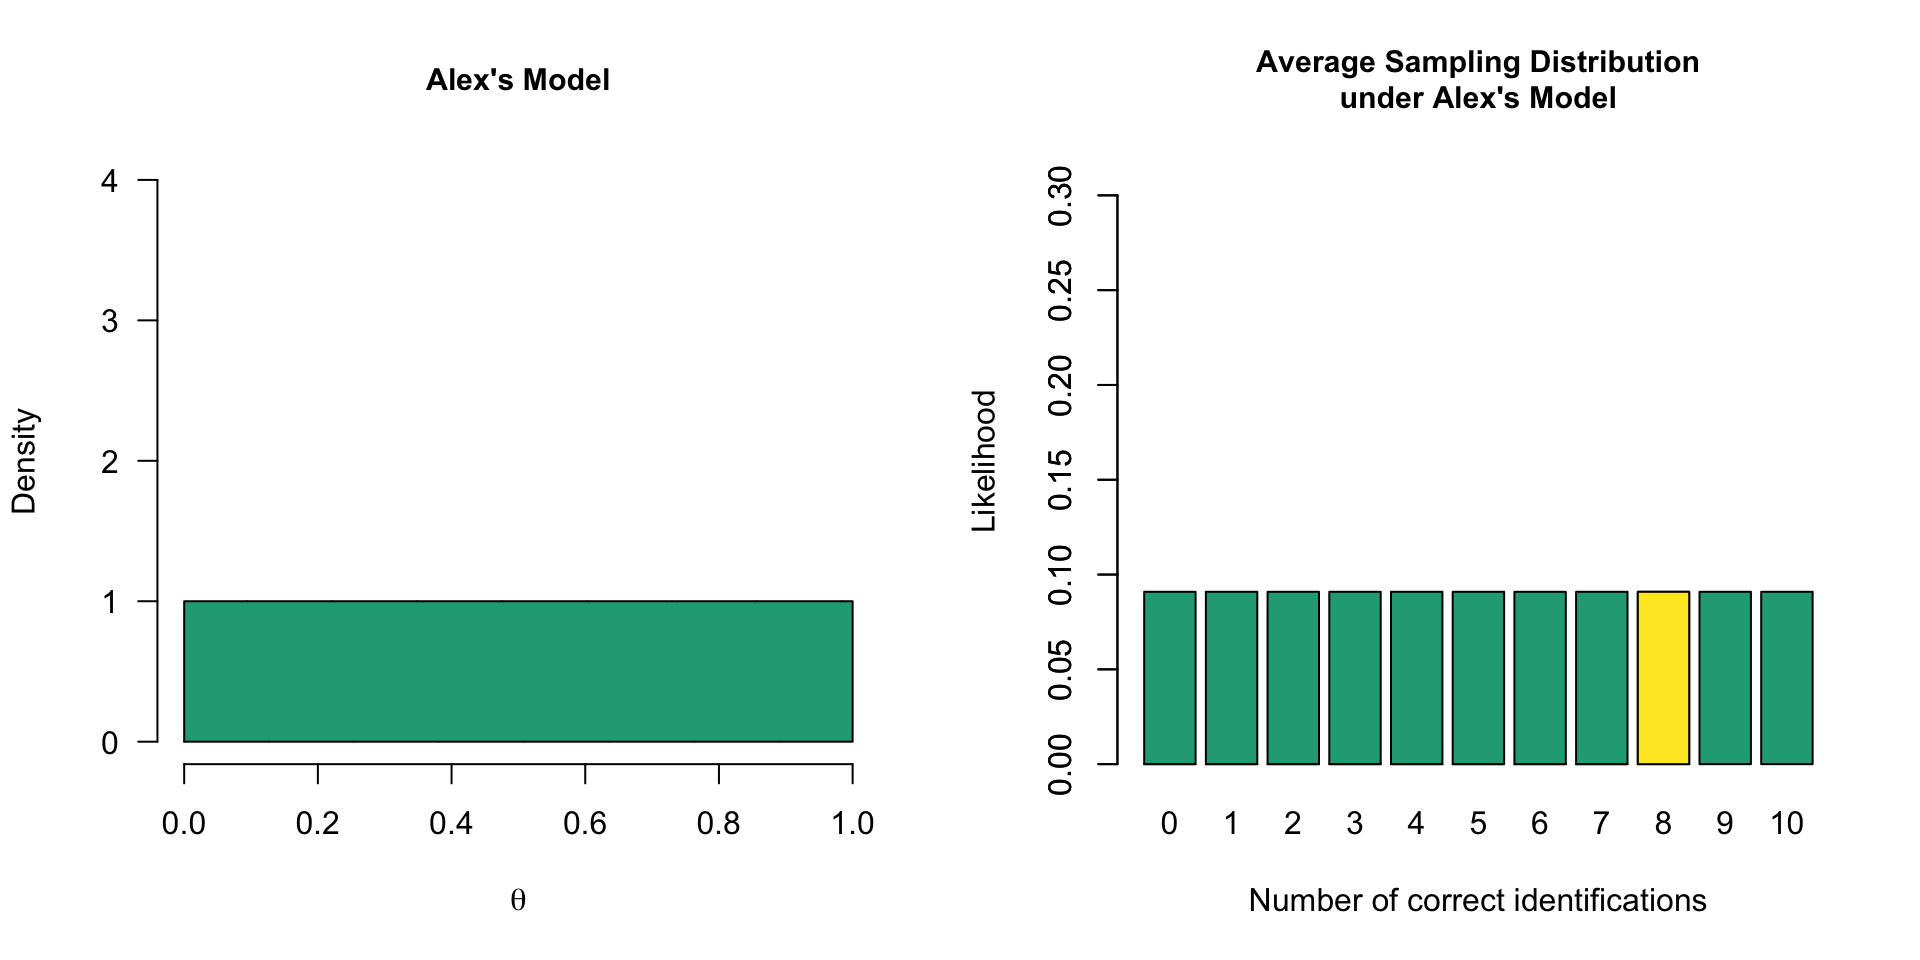
Model with multiple values
One-sided model
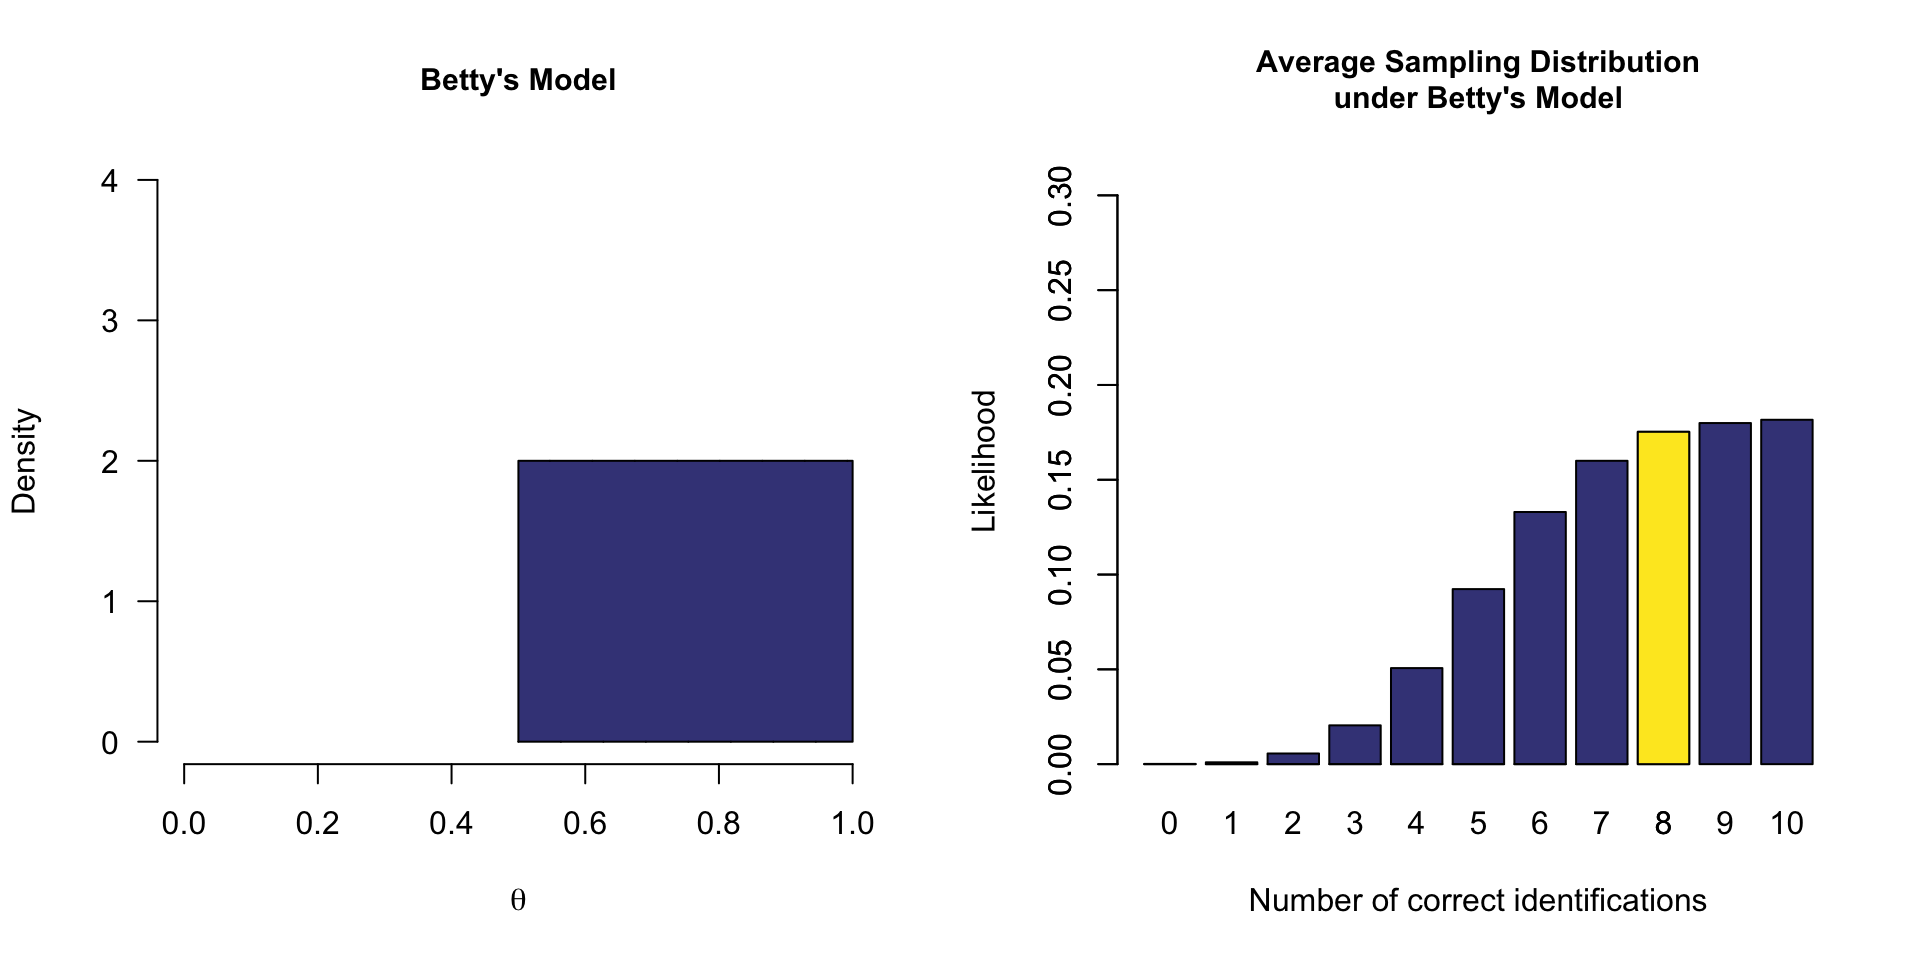
Prior distribution - (\(P(\theta)\))

Each model has assigned a prior probability distribution to the parameter \(\theta\) by means of a probability distribution. In the case of a proportion, a convenient distribution is the Beta distribution because it also has a domain of [0,1].

Now what is the data saying

Ten tasters

\(\begin{aligned} k &= 8 \\ n &= 10 \end{aligned}\)

k = 8
n = 10

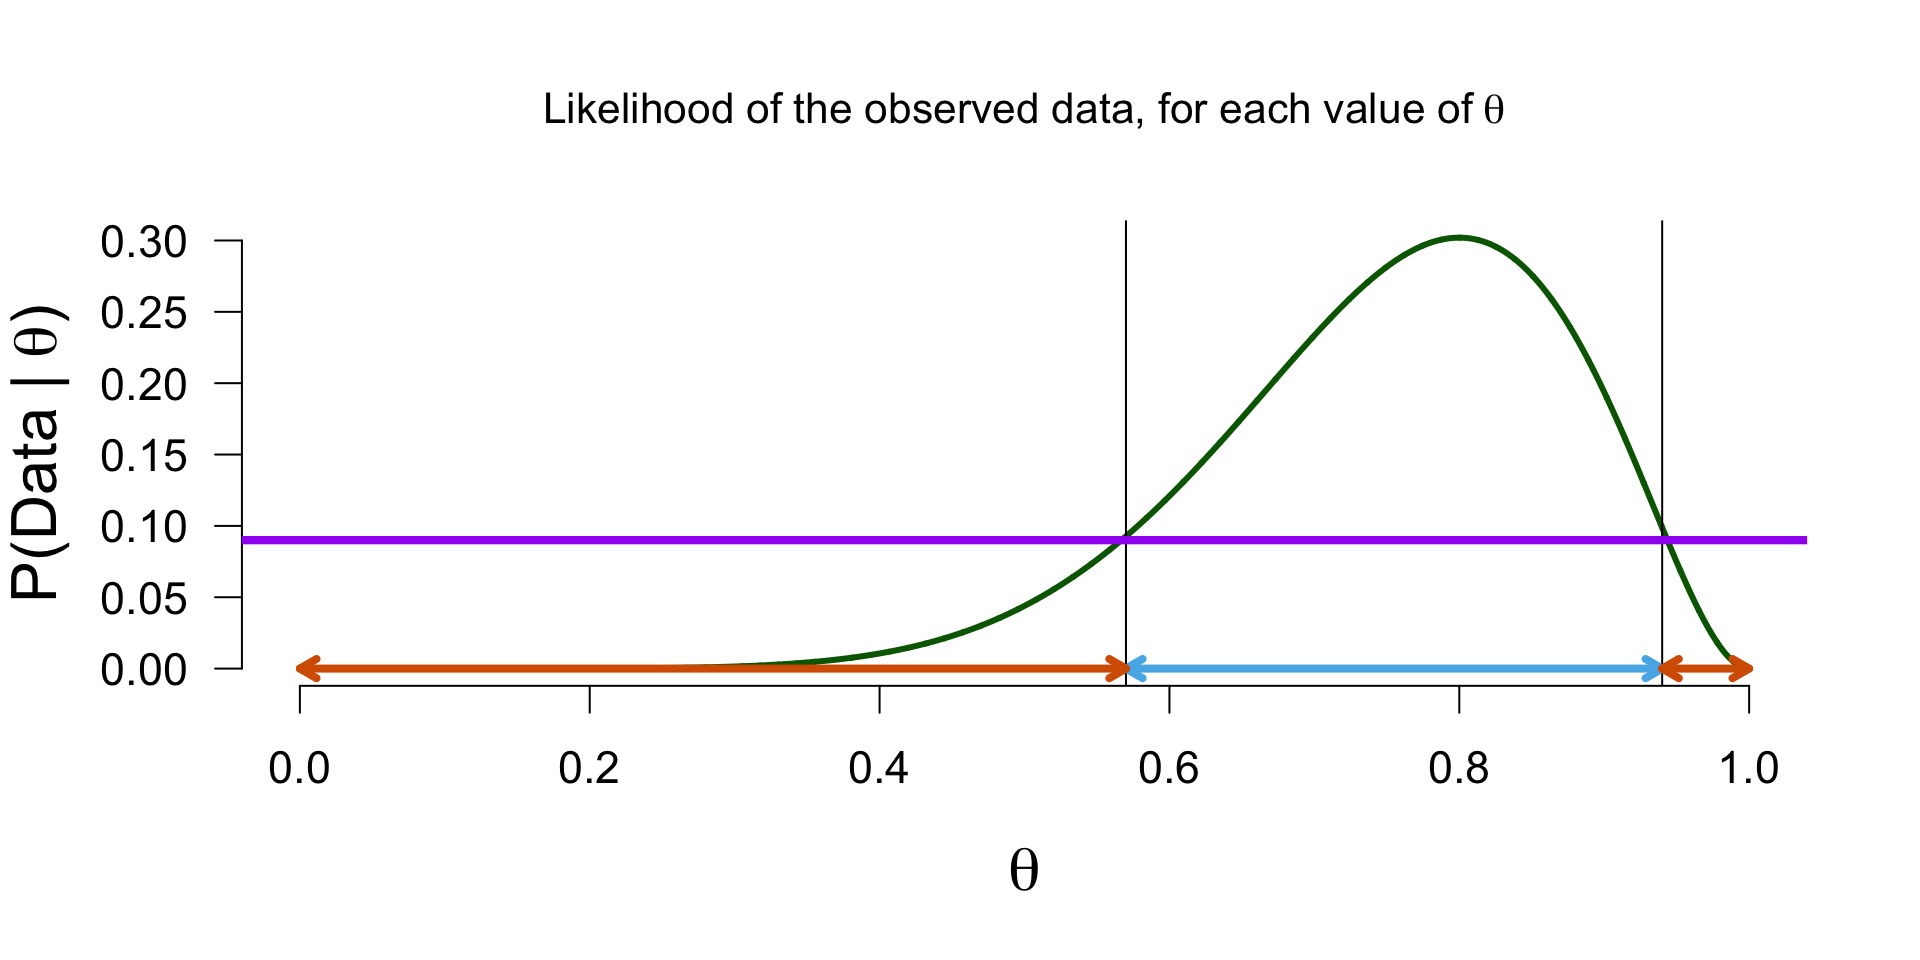
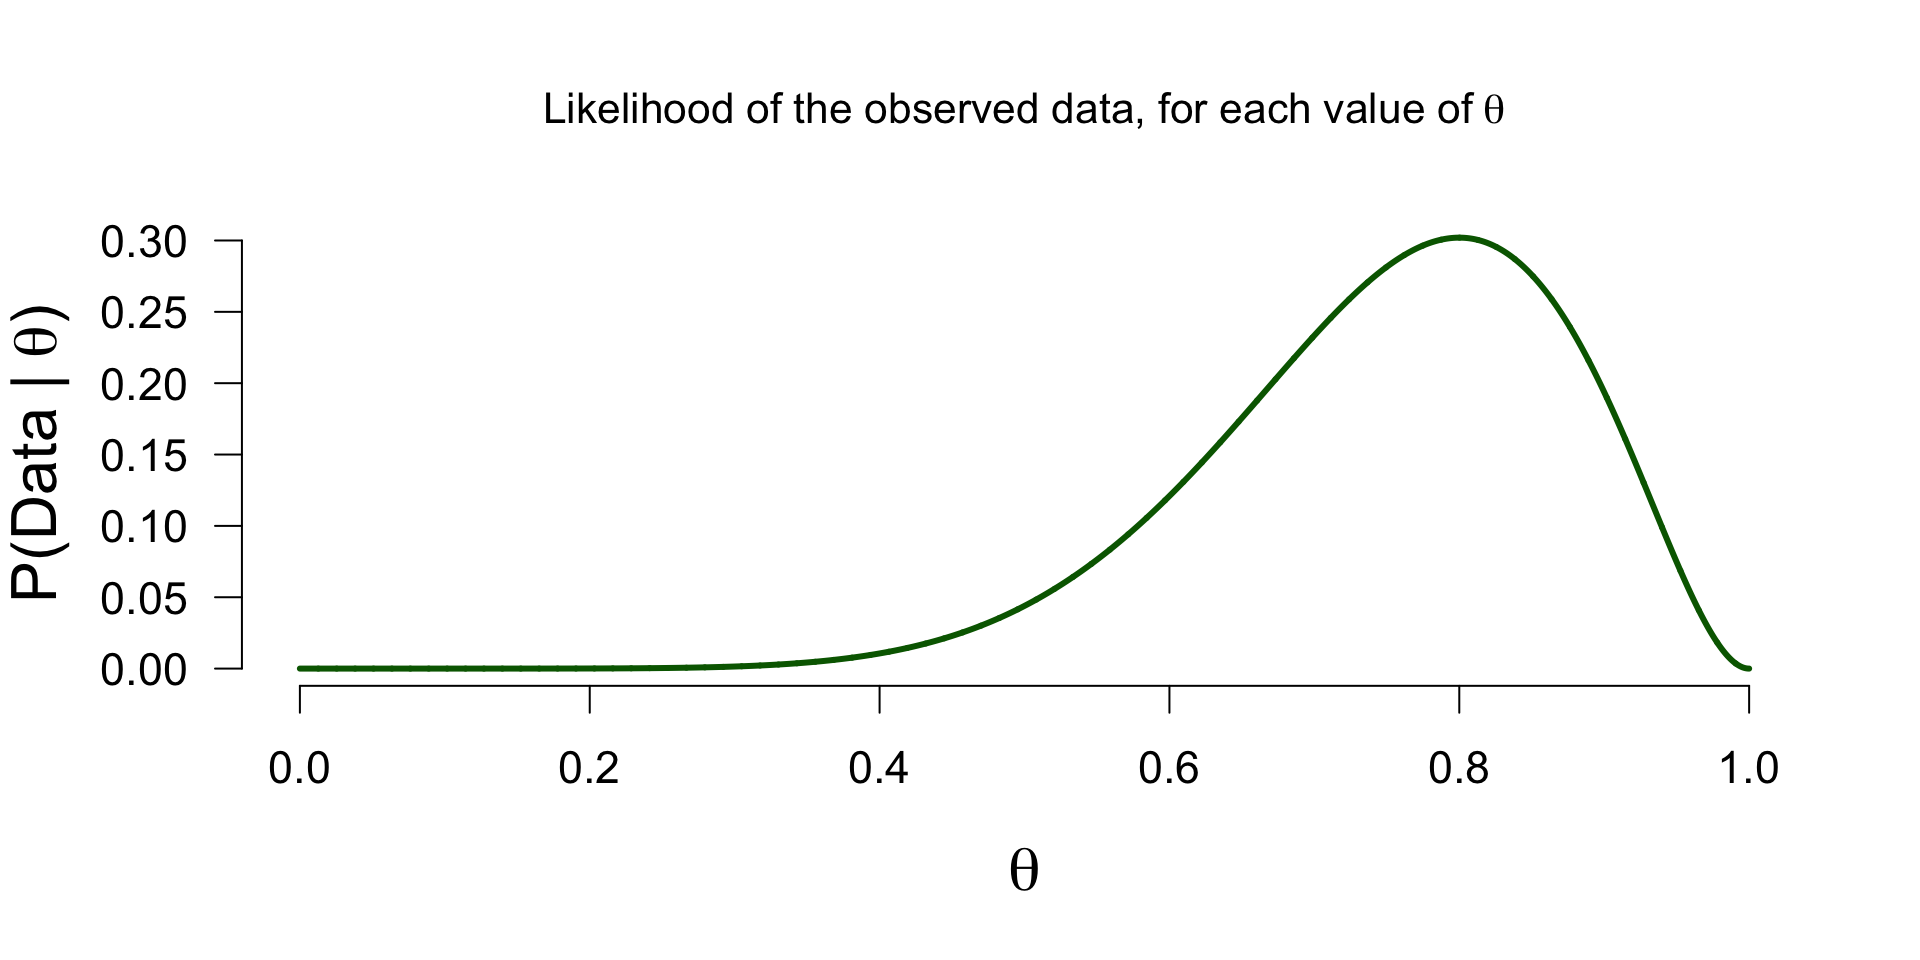
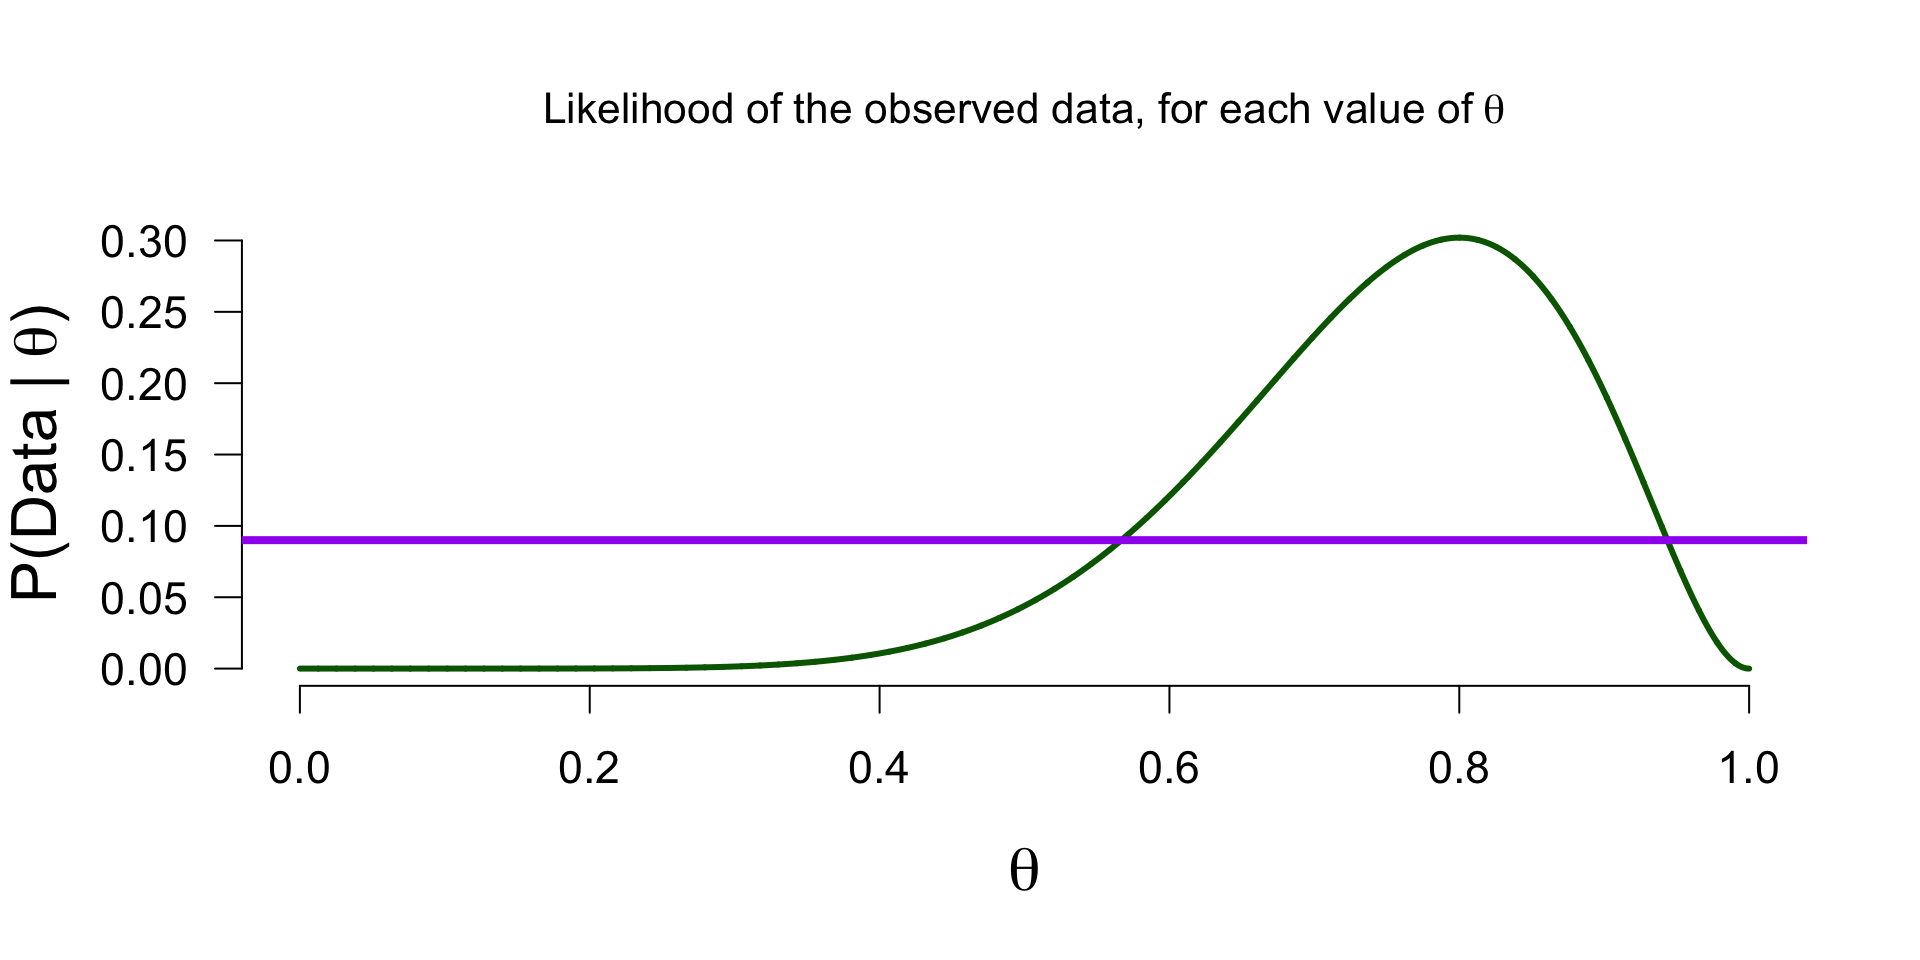
Likelihood function - \(P(data | \theta)\)

How likely is 8 out of 10 for all possible \(\theta\) values?

\[\binom{n}{k} \theta^k (1-\theta)^{n-k}\]
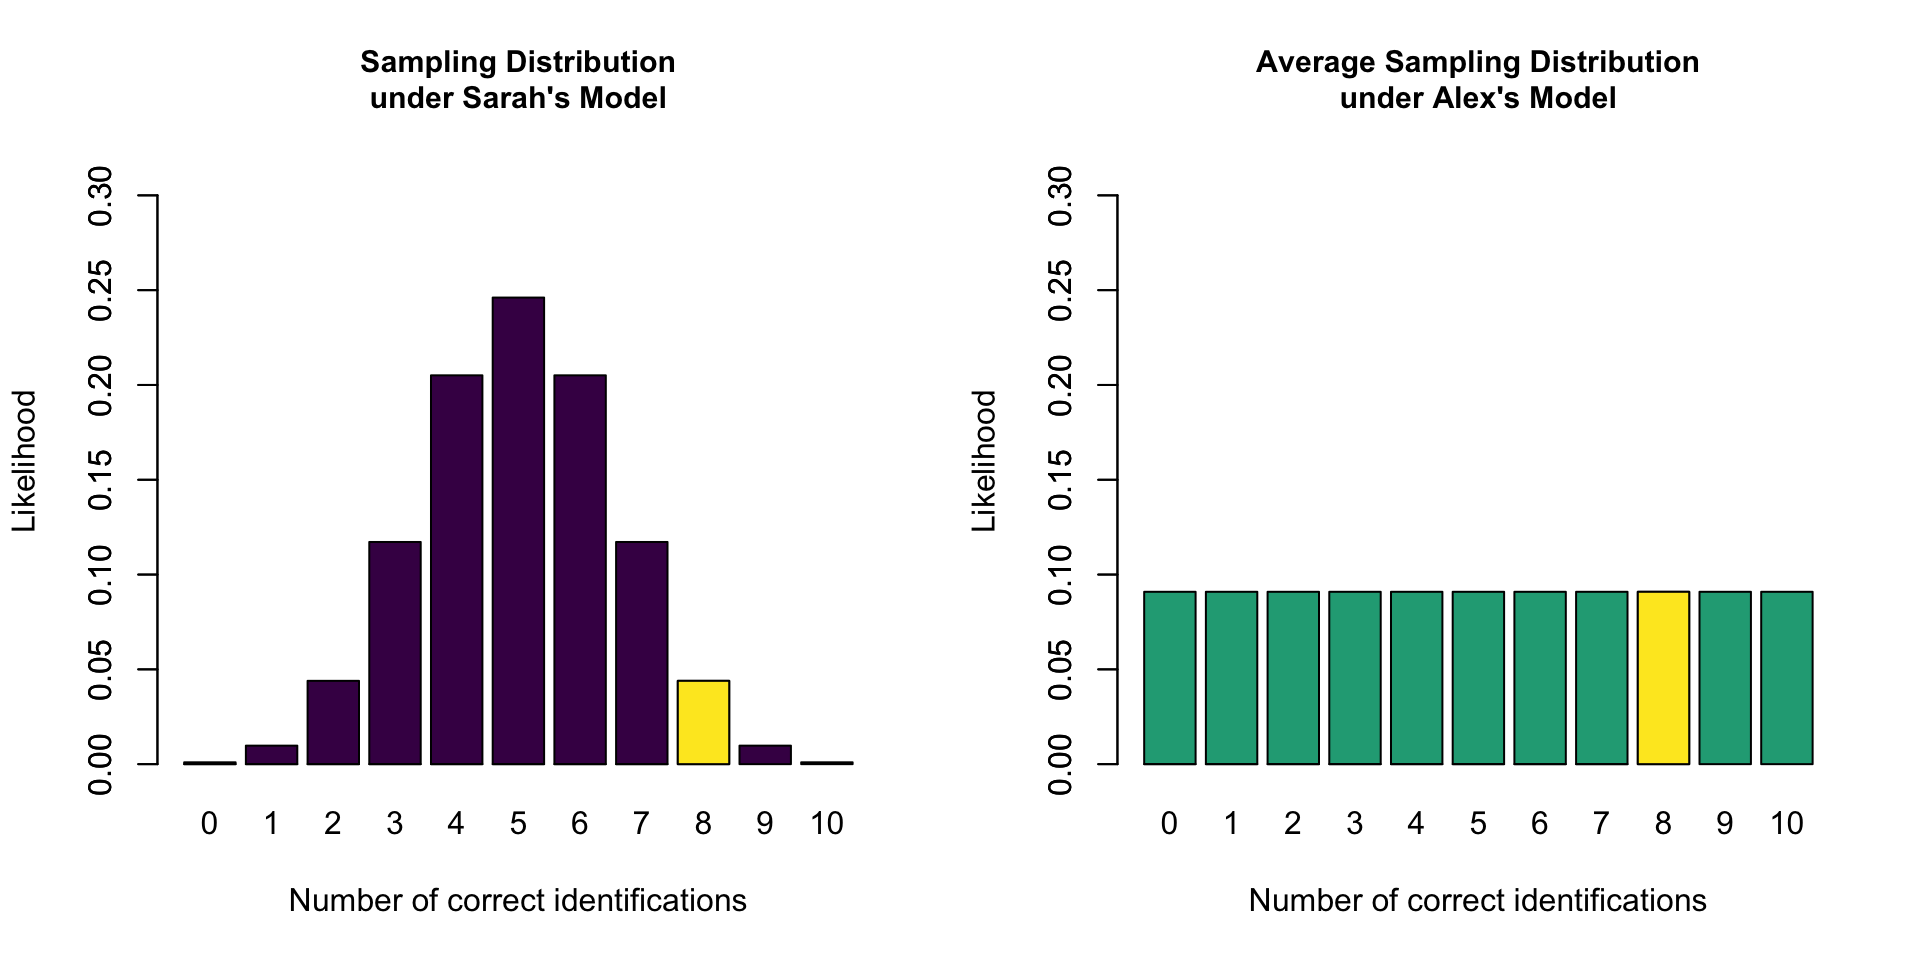
Marginal likelihood - \(P(data)\)

How likely is 8 out of 10 for all \(\theta\) values in the model, on average?
Posterior

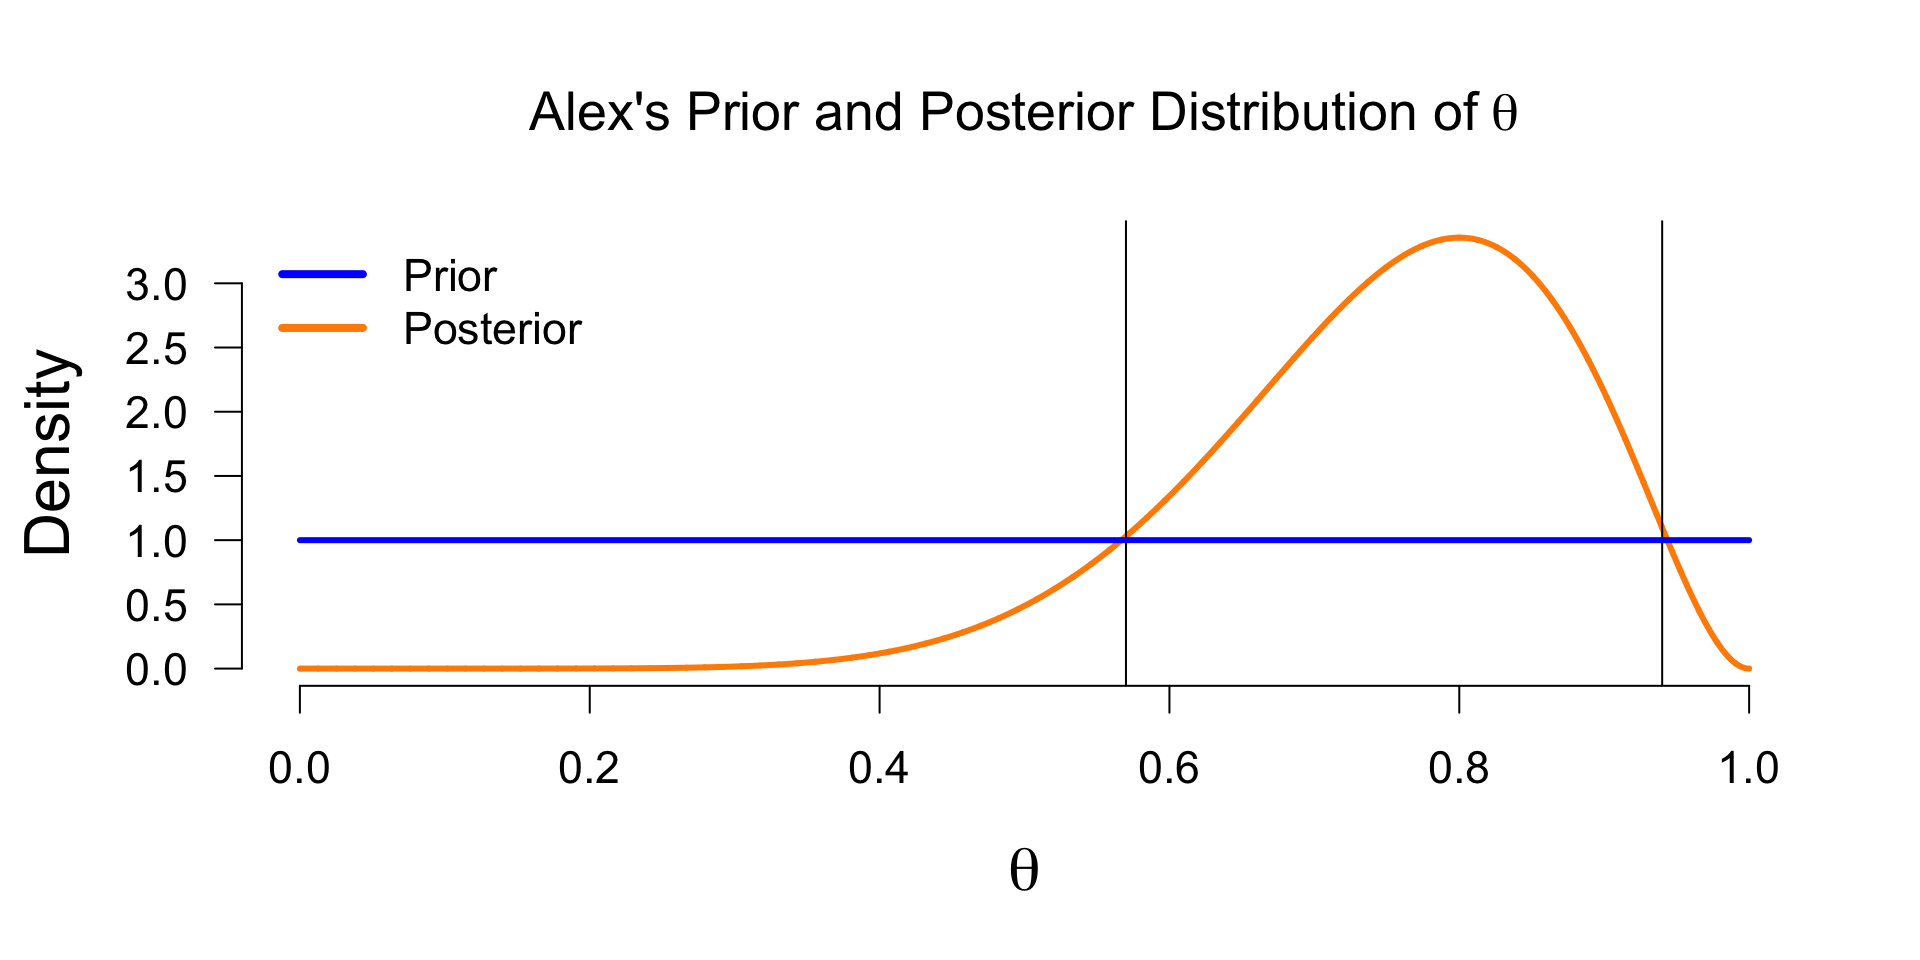
Now we can update Alex’s belief about the possible values of theta based on the data (the likelihood function) we found. Values with a likelihood higher than the average likelihood receive a boost, and others receive a penalty, in plausibility.

Updating beliefs

Posterior distribution - \(P(\theta | data)\)
Bayesian estimation

The posterior distribution is a probability distribution, so we can make probabilistic statements based on it:

In the Bayesian framework, this is known as the credible interval. This interval entails taking the middle \(x\)% of the posterior distribution. For instance, we can take a 95% credible interval, which ranges from \(0.482\) to \(0.940\) in this case. This means that under Alex’s model, there is a 95% probability that the true value of \(\theta\) is between \(0.482\) and \(0.940\).

Take home message

  • Bayesians quantify uncertainty through distributions.
  • The more peaked the distribution, the lower the uncertainty.
  • Incoming information continually updates our knowledge; today’s posterior is tomorrow’s prior.

Bayesian hypothesis testing

Bayesian Hypothesis Testing

  • \(H_0\), the null hypothesis. For instance \(\theta = .5\) (people cannot taste the difference between alcoholic and non-alcoholic beer).
  • \(H_A\) is the hypothesis that relaxes the restriction imposed by \(H_0\), and instead considers multiple values for \(\theta\).

Prior Belief

\[\large \underbrace{\frac{P(H_A \mid data)}{P(H_0 \mid data)}}_\textrm{Posterior odds} = \underbrace{\frac{P(H_A)}{P(H_0)}}_\textrm{Prior odds} \times \underbrace{\frac{P(data \mid H_A)}{P(data \mid H_0)}}_\textrm{Bayes Factor}\]

Bayes Factor

\[\underbrace{\frac{P(data \mid H_A)}{P(data \mid H_0)}}_\textrm{Bayes Factor}\] A ratio of the marginal likelihood of the data for the alternative and the null models.

A Bayes factor of \({BF}_{10} = 3\), means that the data are 3 times more likely under the alternative model than under the null model.

Bayes Factor

  • Sarah’s model has a marginal likelihood of 0.0439 for 8 correct identifications
  • Alex’s model has a marginal likelihood of 0.0909 for 8 correct identifications
  • \(\text{BF}_{SA} =\) 0.0439 / 0.0909 = 0.48
  • The data are 0.48 times more likely under Sarah’s model than under Alex’s model
  • The data are 2.07 times more likely under Alex’s model than under Sarah’s model

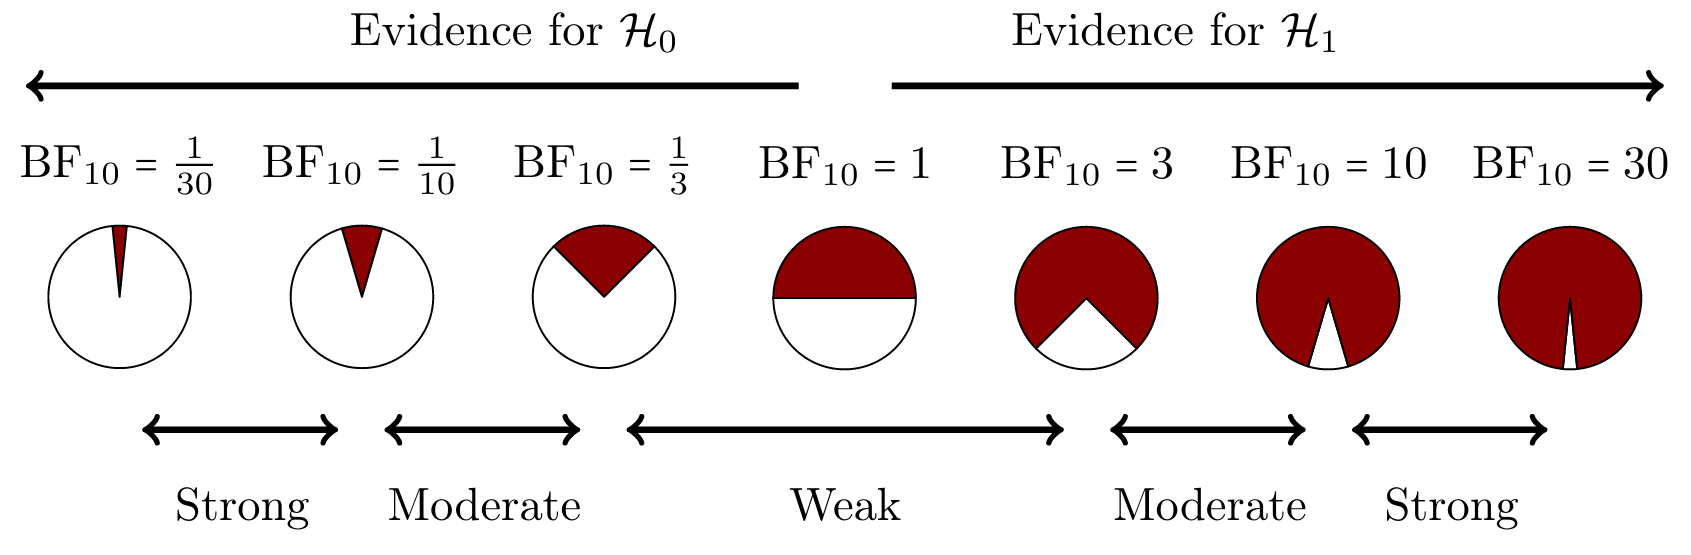
Heuristics for BF

Heuristics for the Interpretation of the Bayes Factor by Harold Jeffreys

BF Evidence
1 – 3 Anecdotal
3 – 10 Moderate
10 – 30 Strong
30 – 100 Very strong
>100 Extreme

BF pizza

Pizza plots

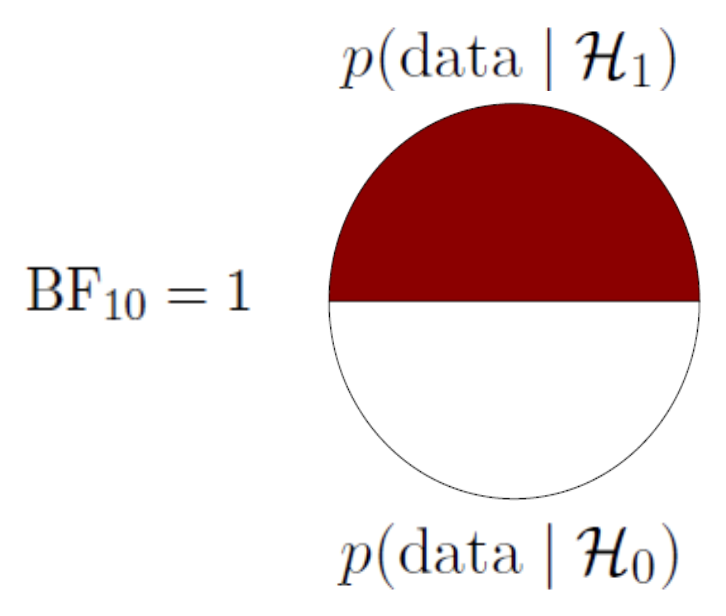
BF pizza

Pizza plot for BF10 = 1

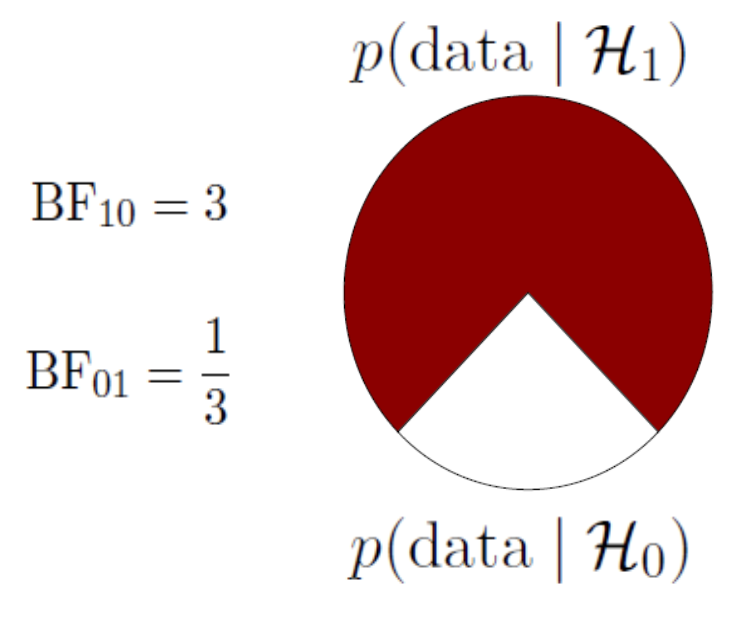
BF pizza

Pizza plot for BF10 = 3

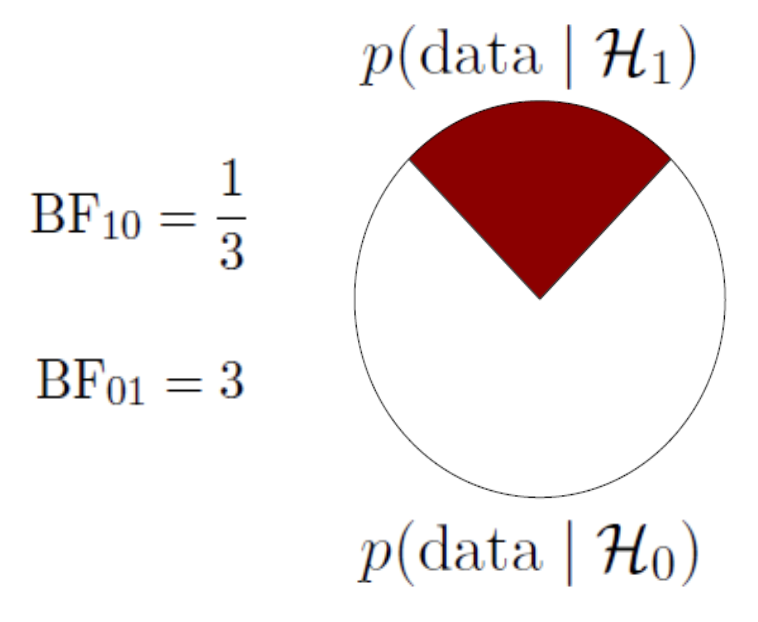
BF pizza

Pizza plot for BF01 = 3

Advantages of the Bayes Factor

  • Provides a continuous degree of evidence without requiring an all-or-none decision.
  • Allows evidence to be monitored during data collection.
  • Differentiates between “the data support H0” (evidence for absence) and “the data are not informative” (absence of evidence).

Bayesian ANOVA

ANOVA in regression formula

Show model predictions using dummy variables:

\[ y_i = b_0 + b_1 \times x_i. \] where \(x_i\) indicates whether we are in group A or group B, then \(b_1\) indicates the group difference (if equal to 0, then no group difference)

Two Models (1 predictor with 2 groups)

\[ y_i = b_0 + b_1 \times x_i \]

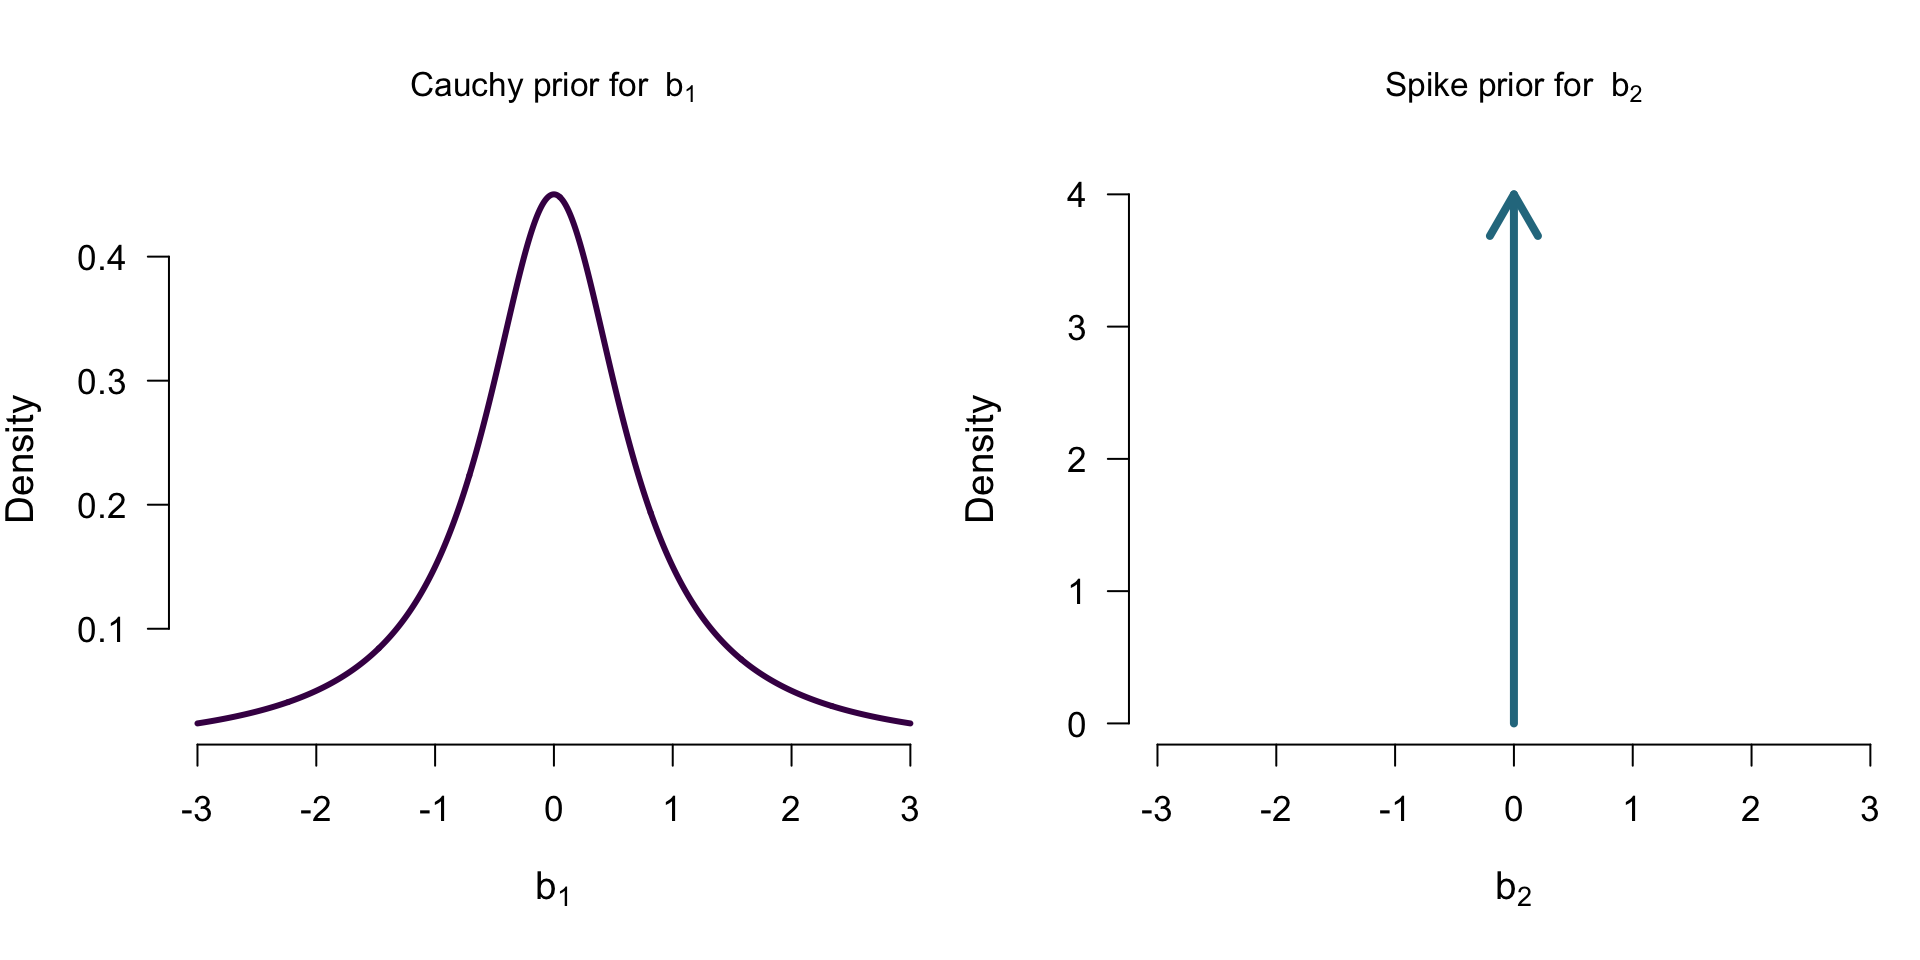
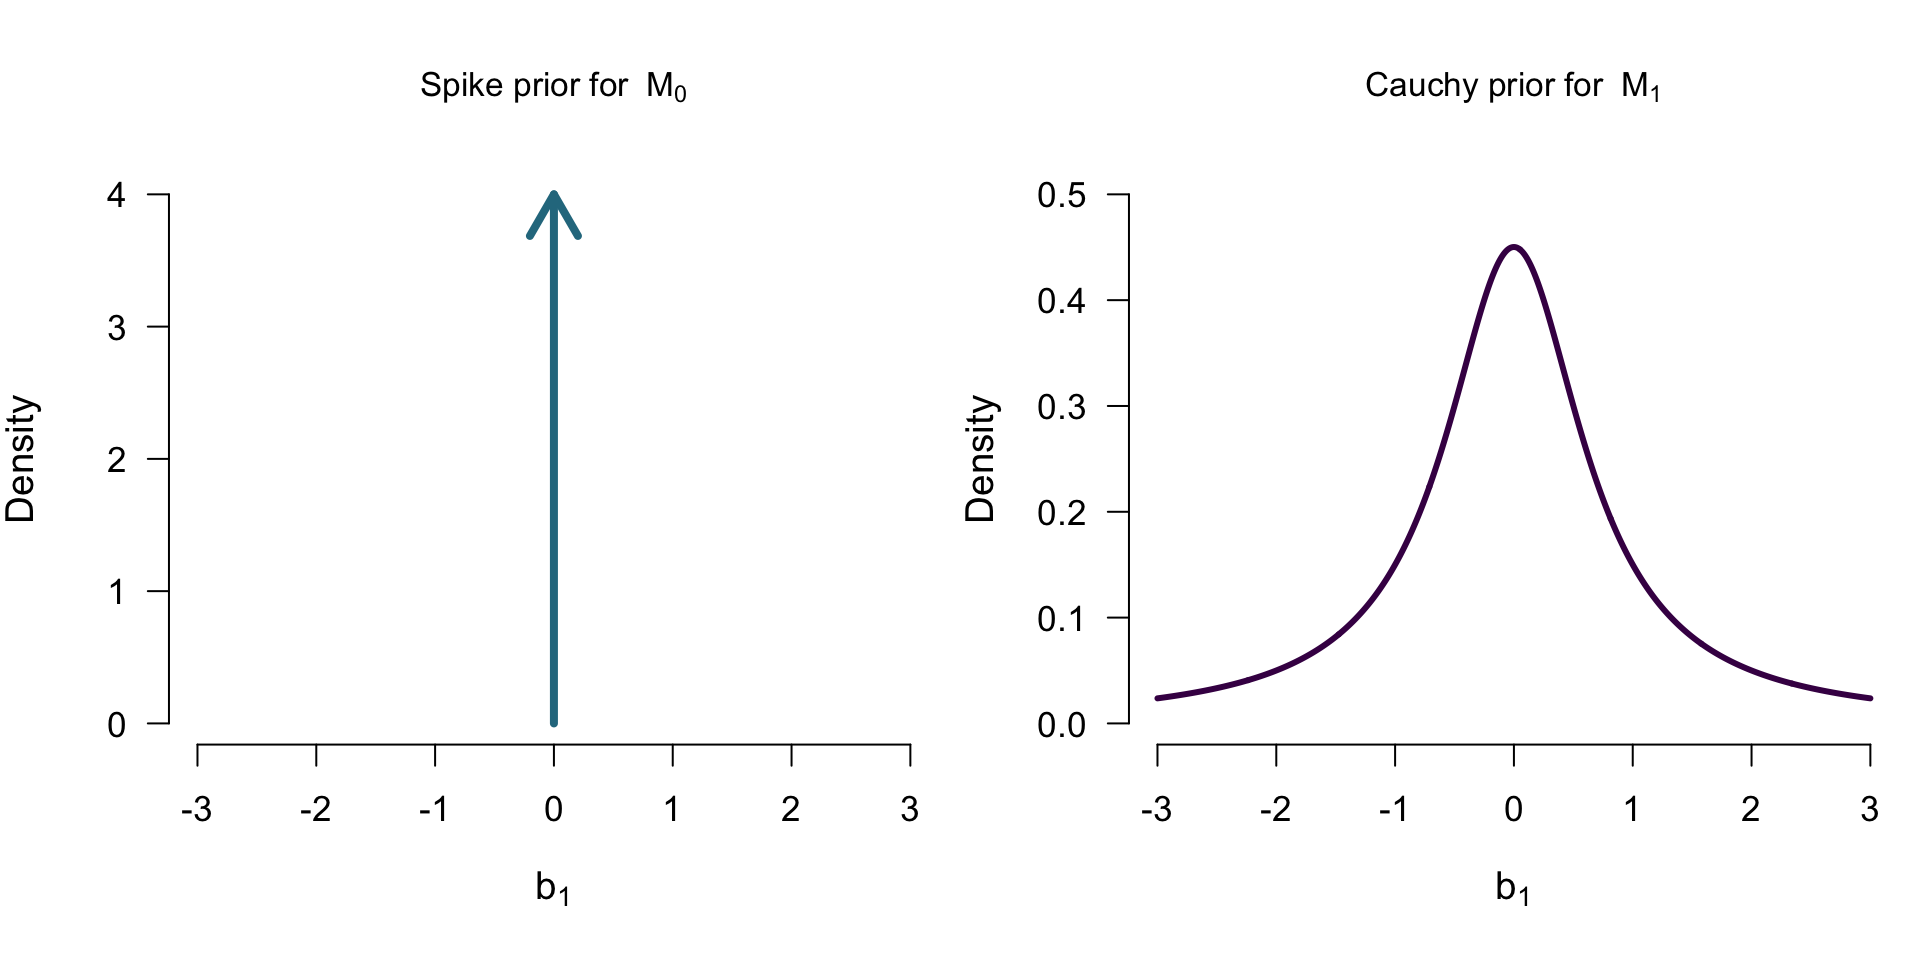
\[\mathcal{M_0}: b_1 = 0 \] \[\mathcal{M_1}: b_1 \sim Cauchy(0.707)\]
Two Models

\[\mathcal{M_0}: b_1 = 0 \] \[\mathcal{M_1}: b_1 \sim Cauchy(0.707)\]

Model Comparison

How well did each model predict the data?

\(\rightarrow\) Marginal likelihood

Marginal Likelihood of \(\mathcal{M}_1\)
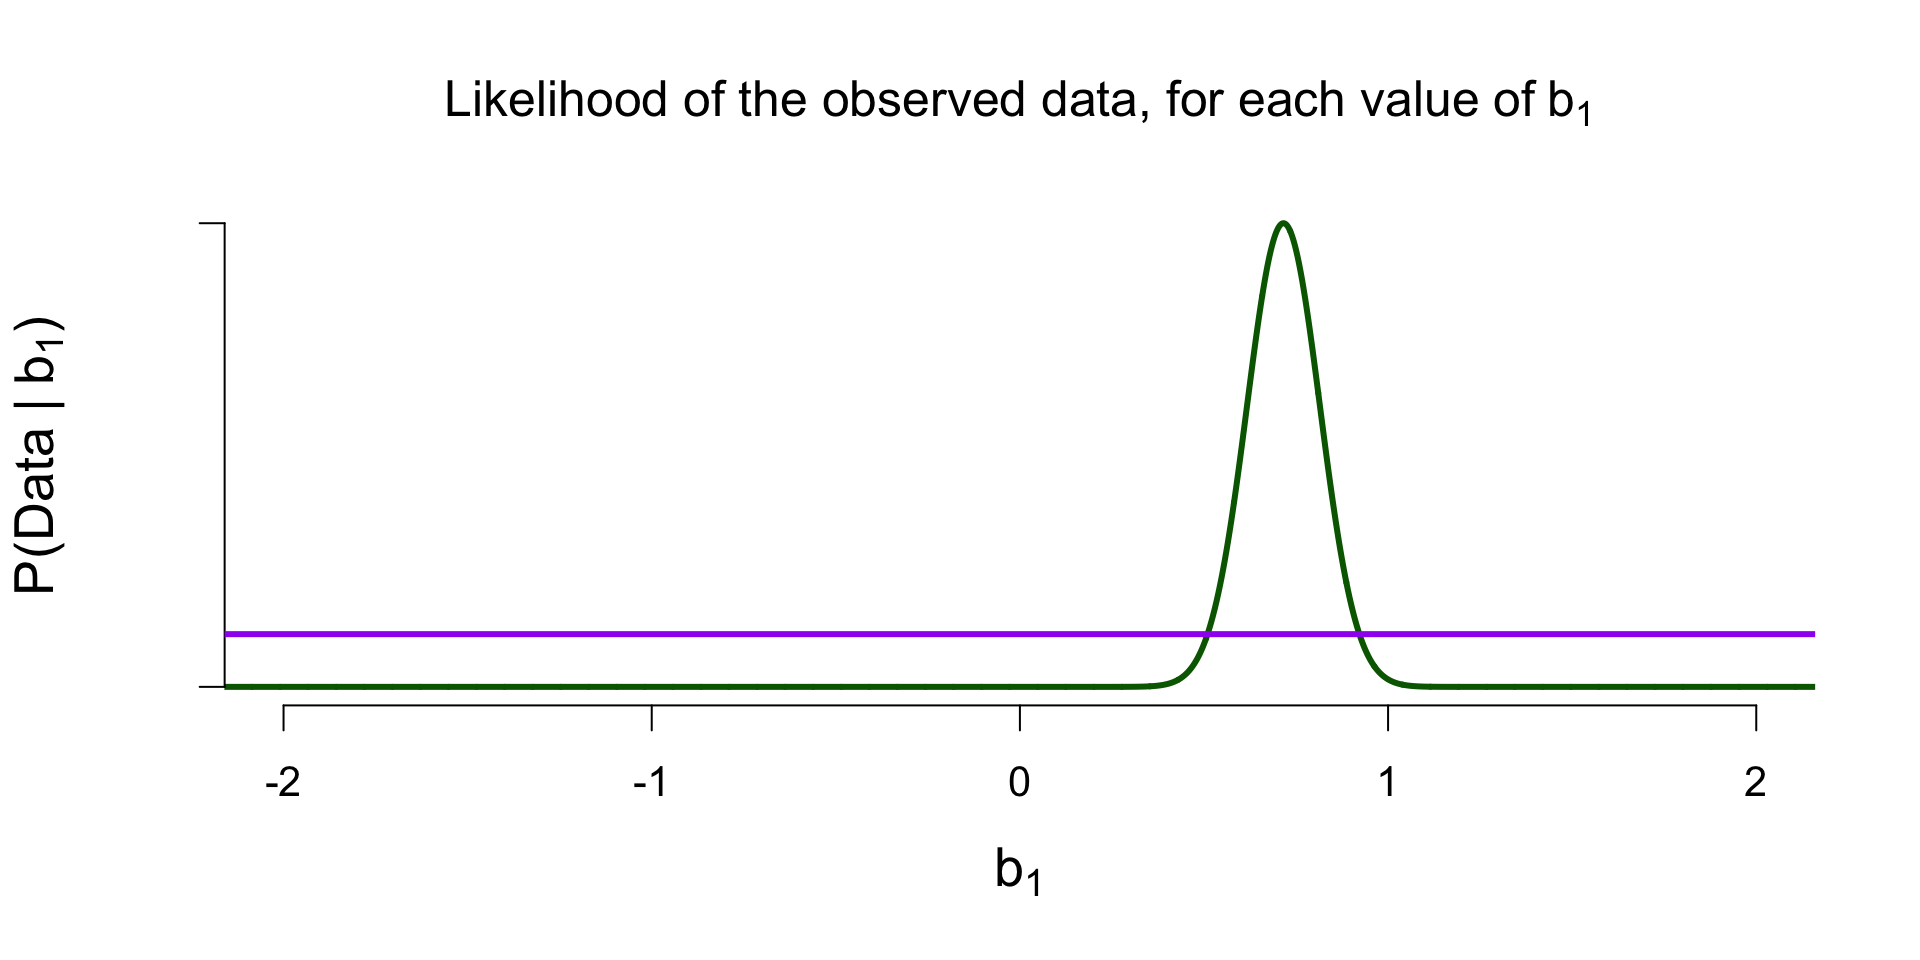
Marginal Likelihood of \(\mathcal{M}_0\)
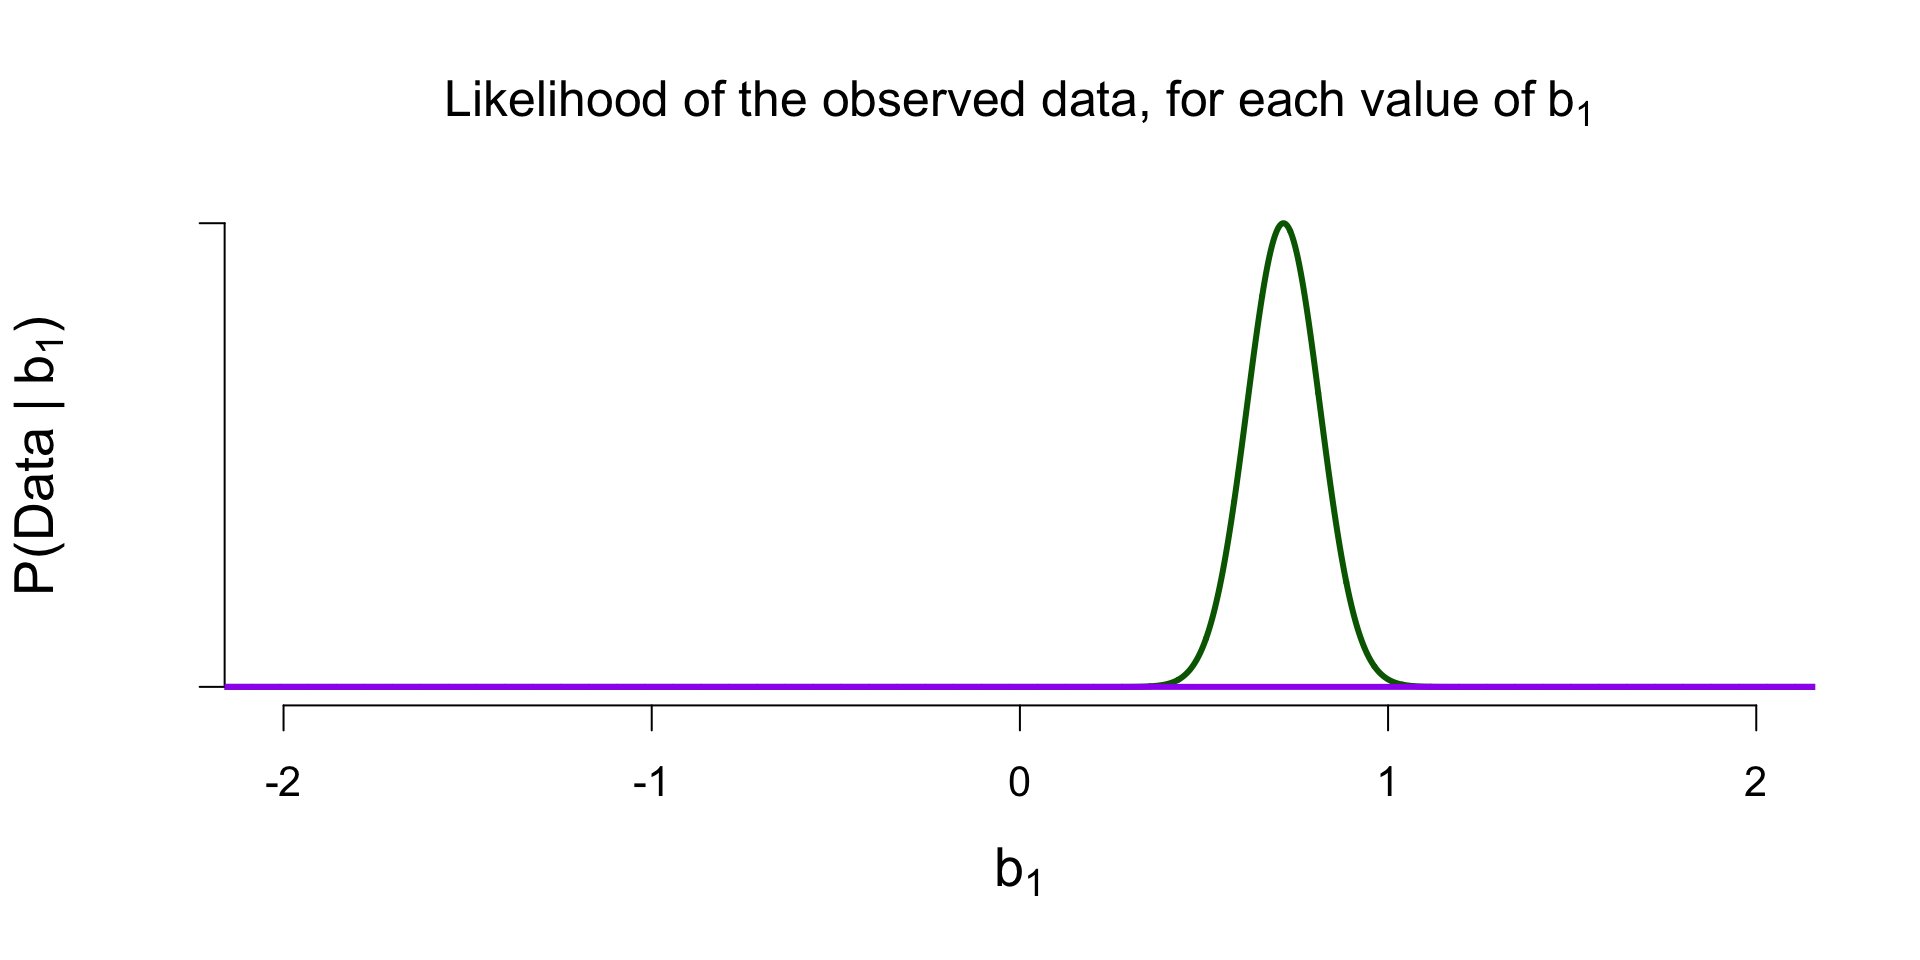
Ratio of Marginal Likelihoods = Bayes Factor

\[\frac{P(data \mid \mathcal{M}_1)}{P(data \mid \mathcal{M}_0)} \approx 10,000\] The data are 10,000 times more likely under \(\mathcal{M}_1\) than under \(\mathcal{M}_0\)

Four Models (2 predictors with 2 groups each)

\[ tastiness = b_0 + b_1 \times alcoholic + b_2 \times correct\]

  • \(\mathcal{M_0}\): model with only the intercept \(b_0\)
  • \(\mathcal{M_A}\): model with the intercept \(b_0\) and the main effect of alcohol \(b_1\)
  • \(\mathcal{M_C}\): model with the intercept \(b_0\) and the main effect of correct identification \(b_2\)
  • \(\mathcal{M}_{A+C}\): model with the intercept \(b_0\) and the two main effects

Priors for \(\mathcal{M_A}\)

Priors for \(\mathcal{M_C}\)
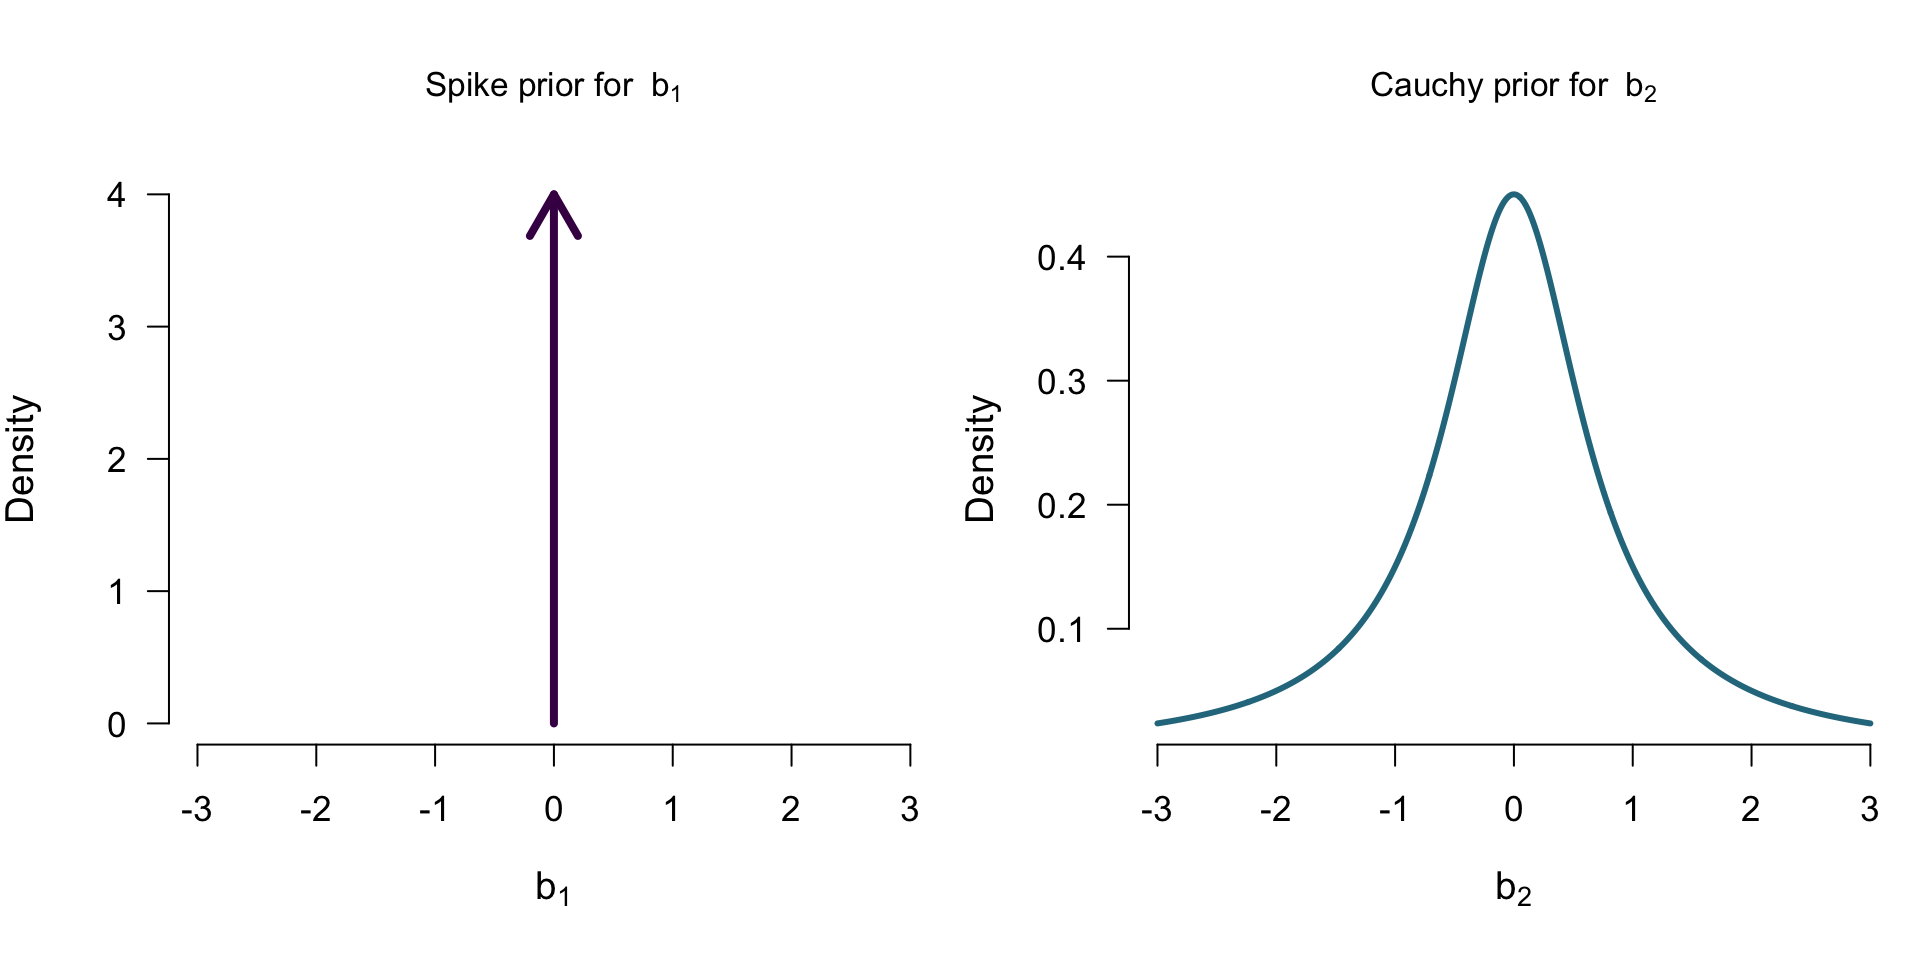
Priors for \(\mathcal{M_{A+C}}\)
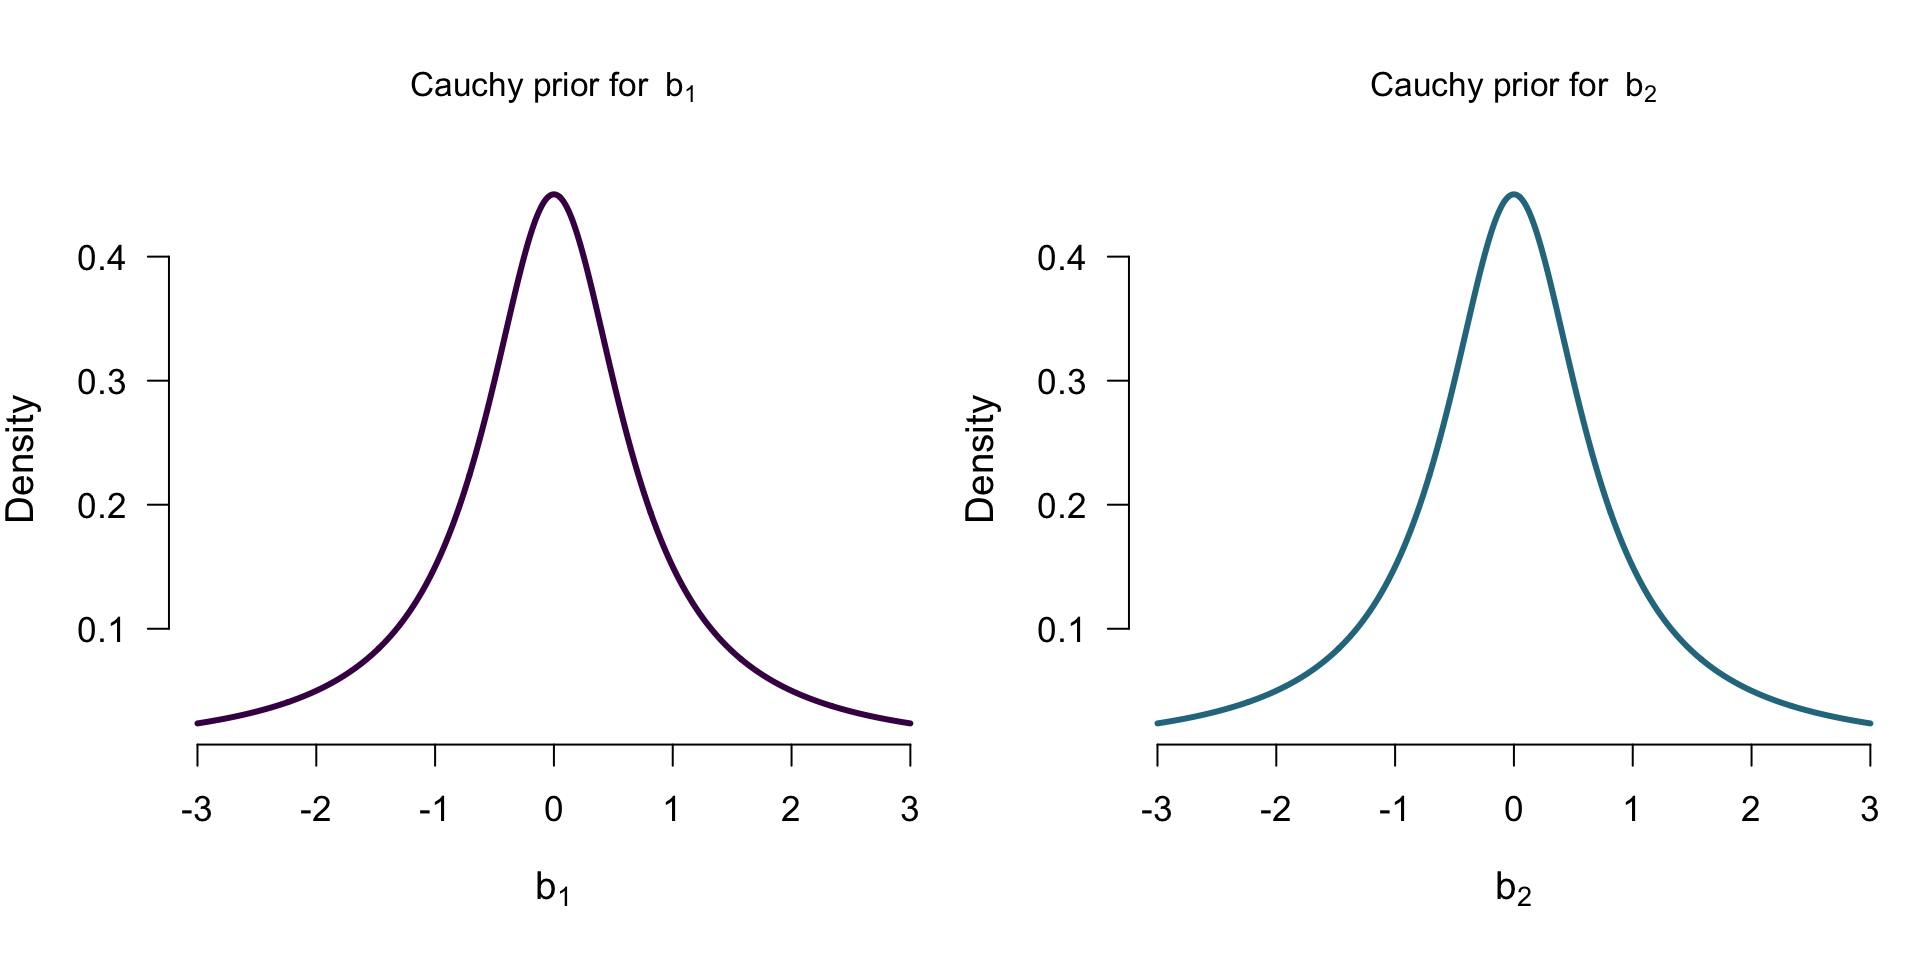
Model comparison results
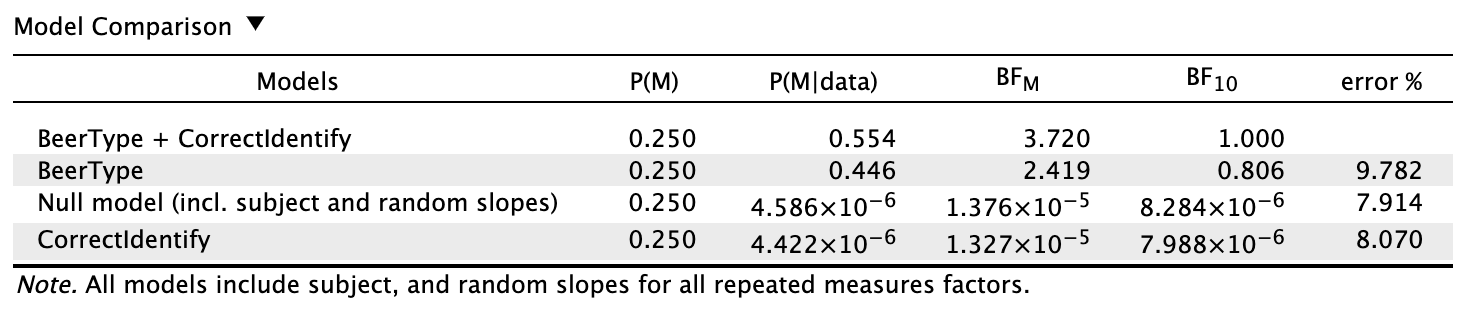
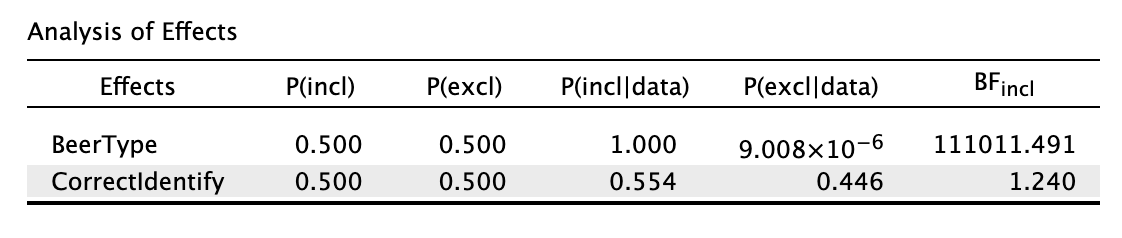
Bayes factor table

Looking at the individual effects

Bayes factor table

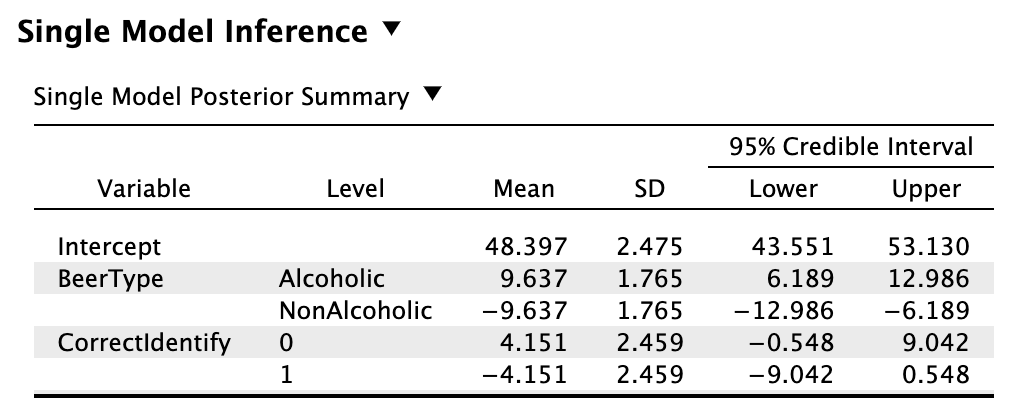
Single model inference

Bayes factor table

Single model inference: Posterior for BeerType
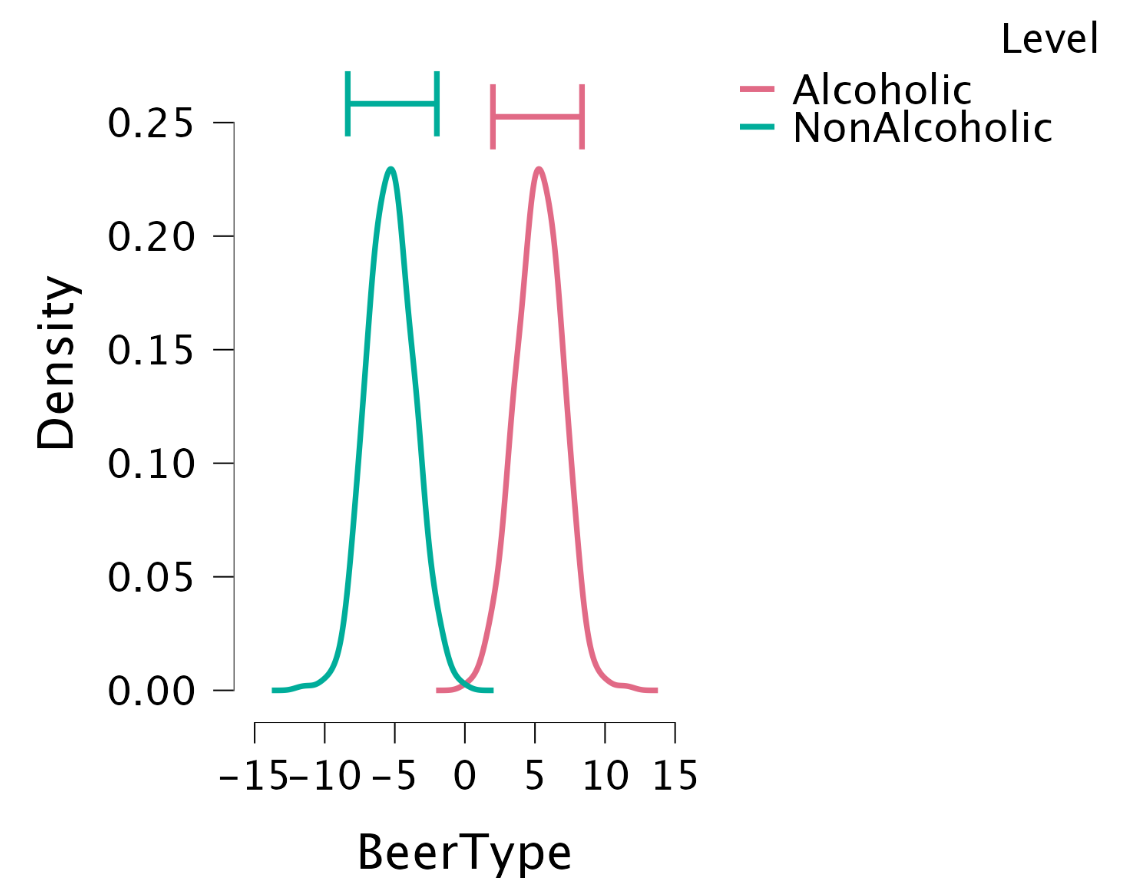
Bayes factor table

Single model inference: Posteriors for CorrectIdentify
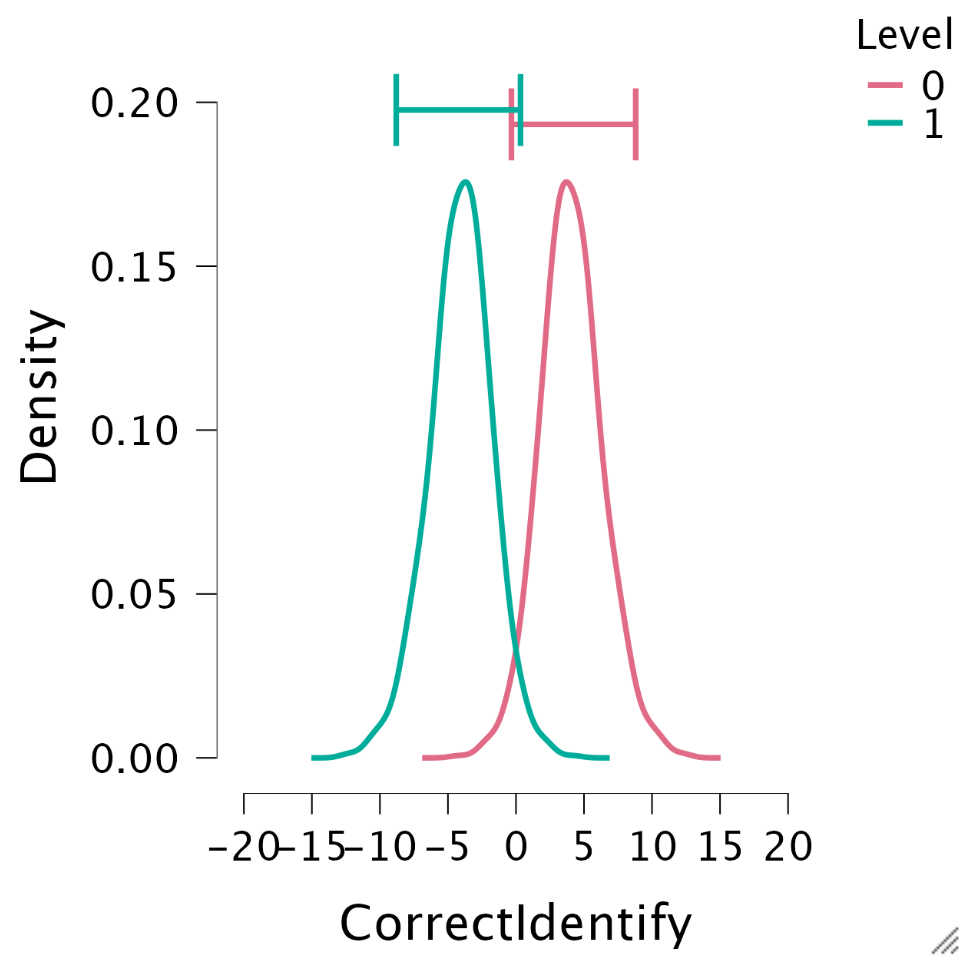
Bayes factor table

Lost?

Info button in JASP

JASP

JASP

Closing

Recap

  • Bayesian statistics is a thing
  • The fun doesn’t stop at t-test/correlation, but extends to ANOVA/regression
    • Obtain evidence for H₀
    • Gradual assessment of evidence
    • Need to specify prior distributions

Bayes and open science in the wild

Pfadt et al. (2026): The prevalence of Bayesian inference, preregistration, and open data in psychology, 2004–2024, 45 authors

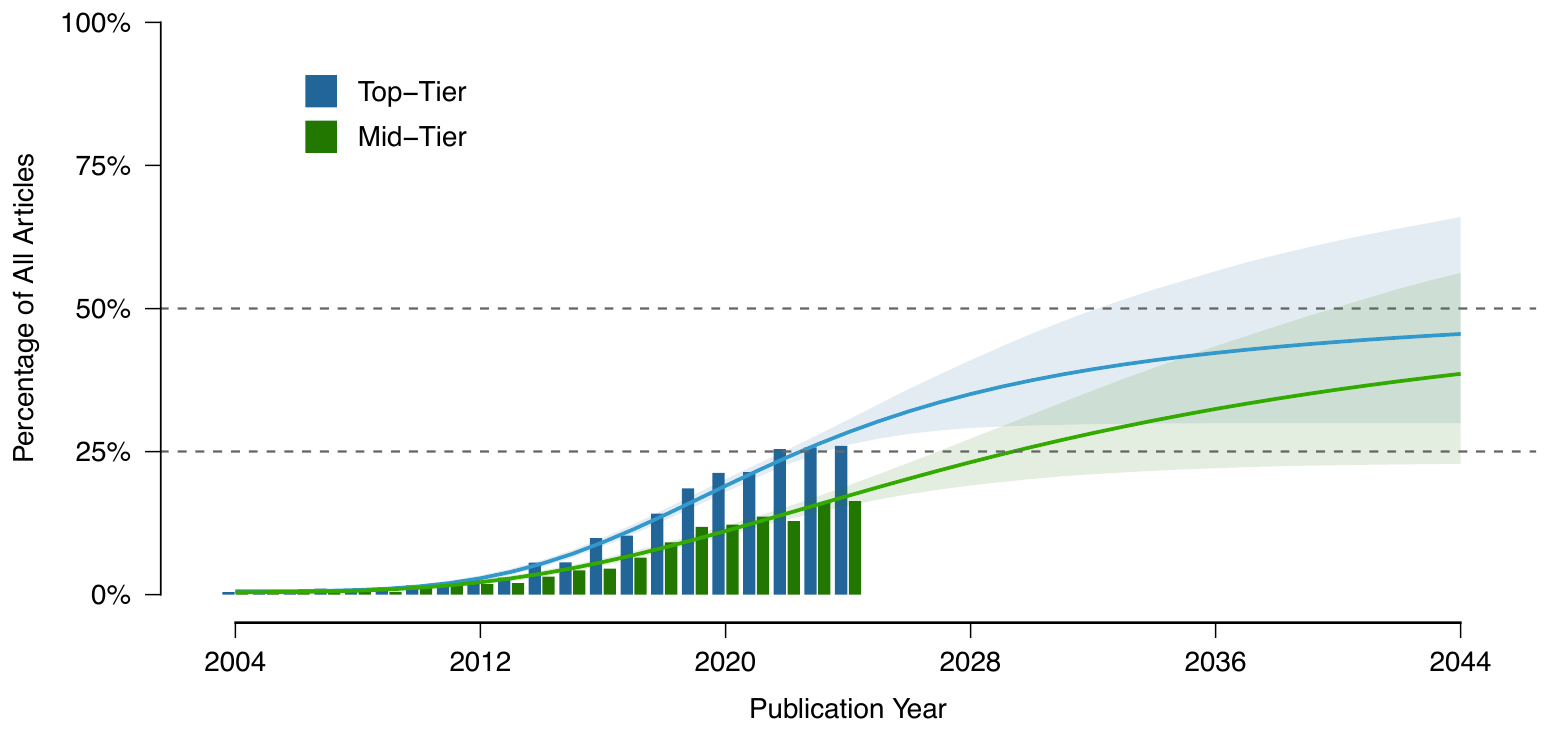
Bayesian analyses

Articles with a Bayesian analysis, 2004-2044

Source: Pfadt et al. (2026), Fig. 1

Preregistration
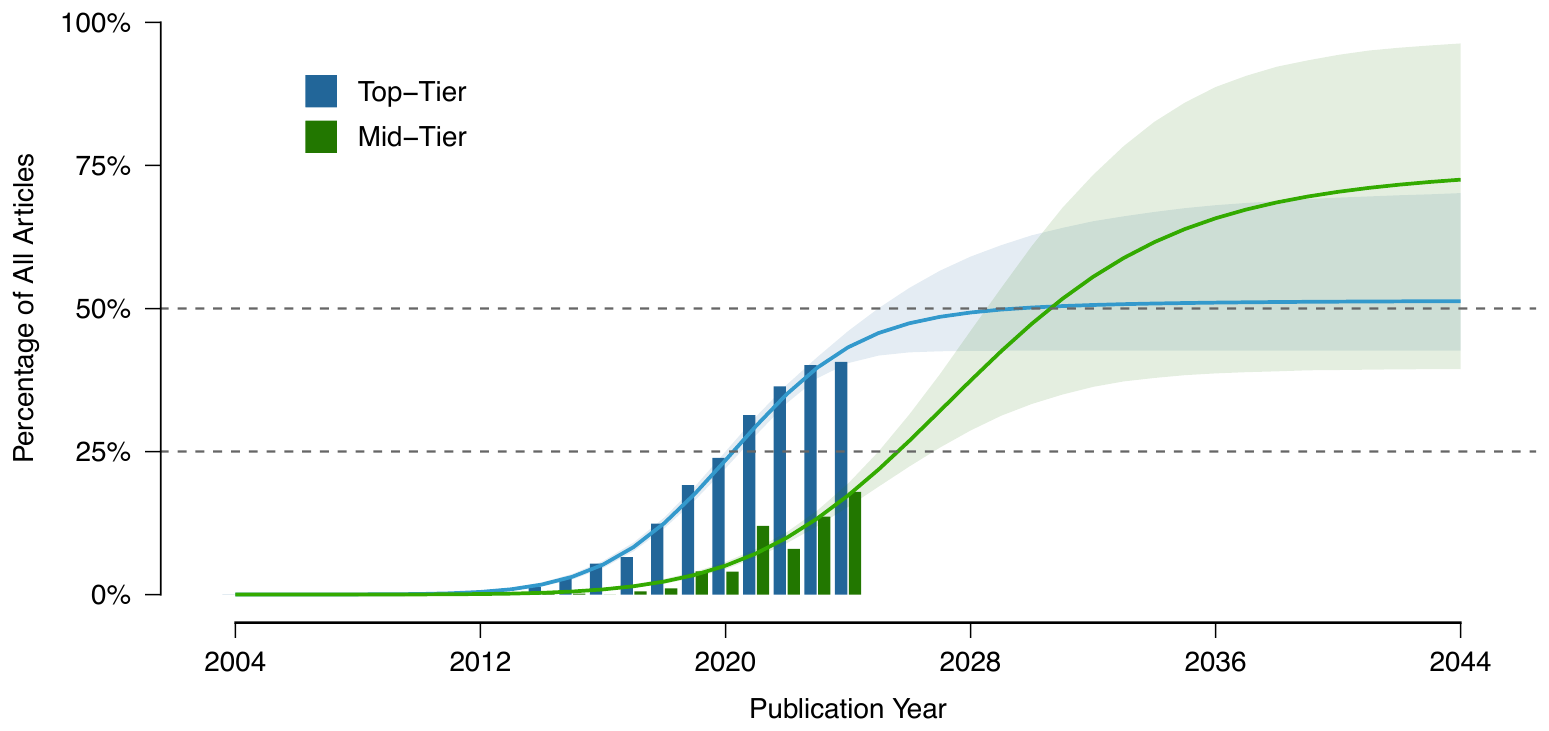
Preregistered articles, 2004-2044

Source: Pfadt et al. (2026), Fig. 2

Open data
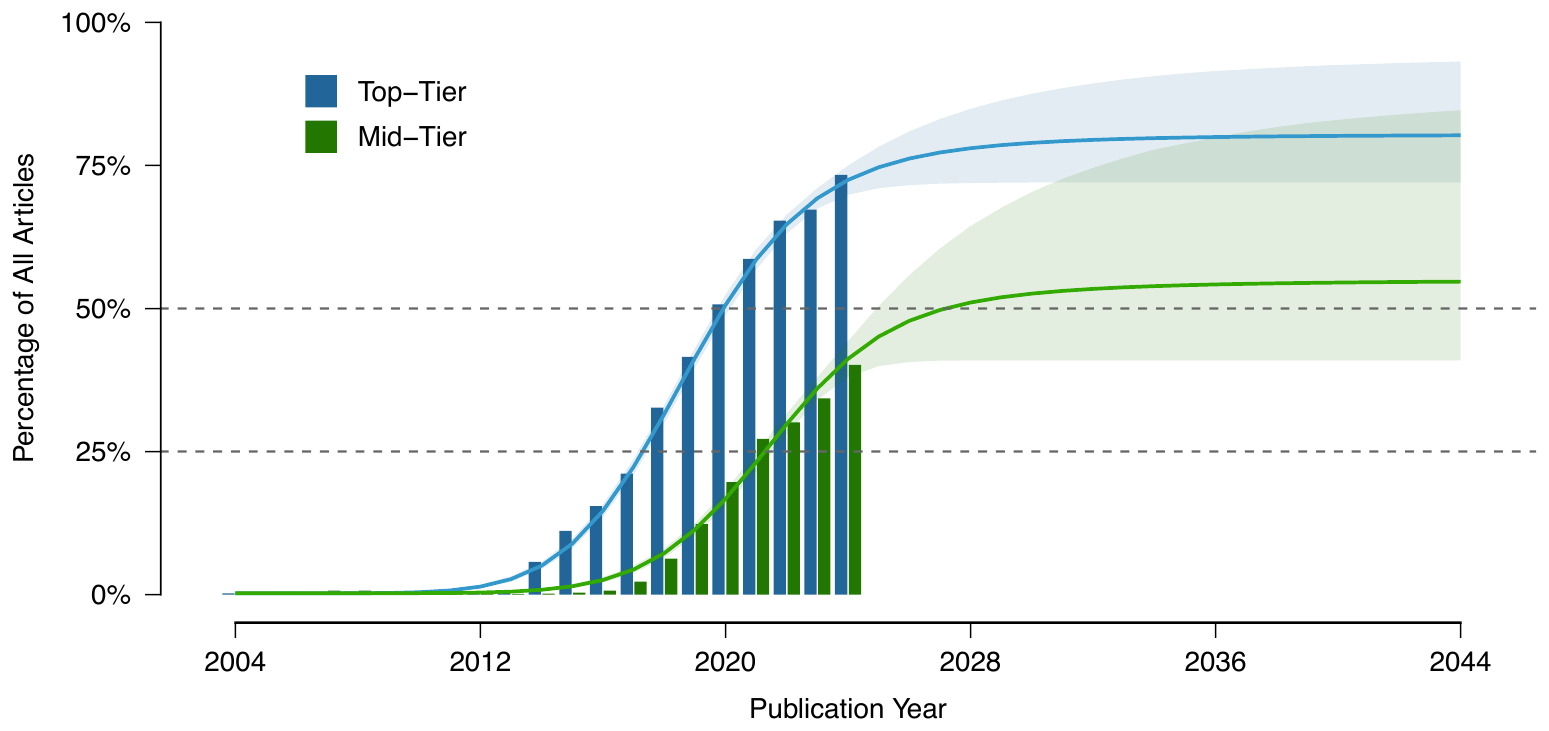
Articles with open data, 2004-2044

Source: Pfadt et al. (2026), Fig. 3

Software reporting
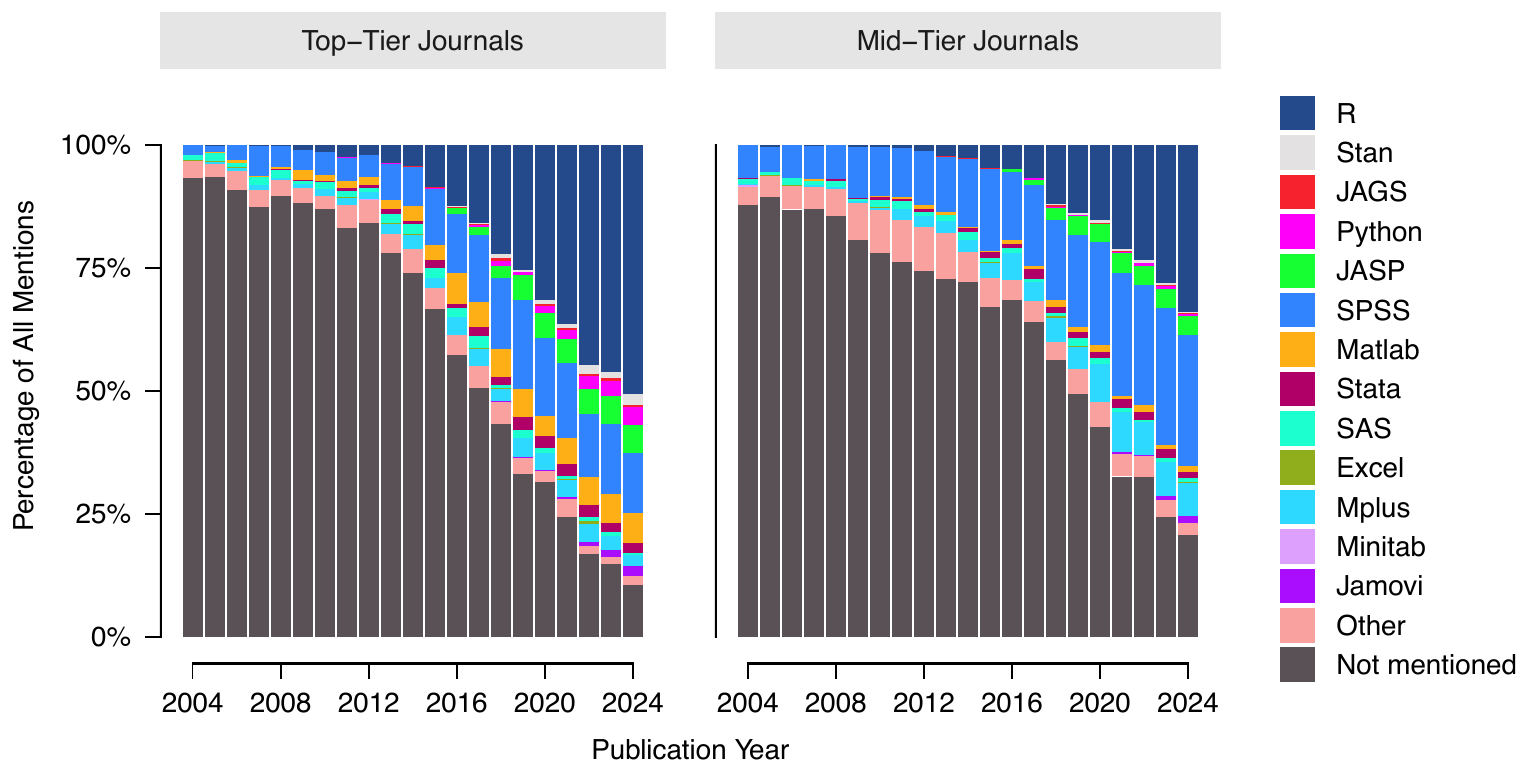
Software mentions in psychology articles, 2004-2024

Source: Pfadt et al. (2026), Fig. 6

Analysis types
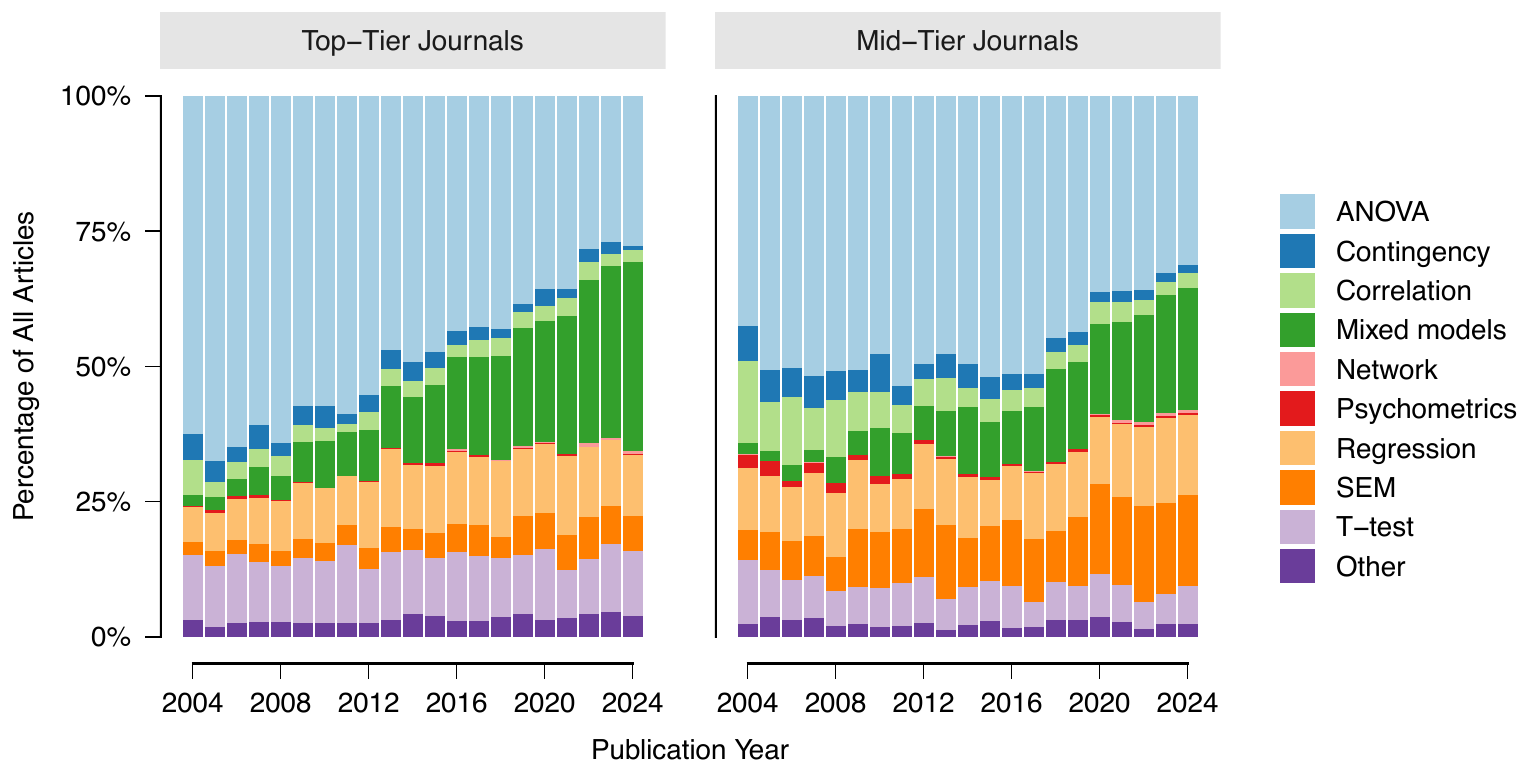
Analysis types in psychology articles, 2004-2024

Source: Pfadt et al. (2026), Fig. 5

Looking back on SSR

\[\text{Outcome} = \text{Model} + \text{Error}\]

Theme In SSR
Model Statistics is relative Many tests compare the predictions of two models
(interaction vs main effects, \(\mathcal{M}_1\) vs \(\mathcal{M}_0\))
Bayes makes the comparison explicit
Error Threats to statistical validity Most assumptions are about the residuals, get a grip on these
Robust alternatives exist, but are usually less powerful
Many choices along the way
All of it Complete reporting Numbers for accuracy (effect size, hypothesis test)
Graphs for vibes

Metrics we have used

Question Metrics
Do we have evidence for an effect? \(p\)-value (\(t\), \(F\), \(\chi^2\)), \(\text{BF}_{10}\)
Which model predicted the data the best? \(R^2\)/\(F\) change + \(p\), adjusted \(R^2\), \(\text{BF}_{10}\), \(\text{BF}_{\text{incl}}\)
How big is the effect? \(d\), \(r\), \(R^2\), \(\omega^2\), rank-biserial \(r\), odds ratio
How precise is this effect estimate? Standard error, 95% CI, 95% credible interval

Alternatives we have not discussed (not exam material)

  • Equivalence testing
  • \(p\)-value as evidence, without \(\alpha\) (Fisher’s original idea)
    • Smaller \(p\), stronger evidence against \(H_0\)
    • Common in practice
  • AIC / BIC
    • Model fit with a penalty for complexity
    • BIC approximates the Bayes factor
  • Multiverse analysis

Exam note: mediation (lecture 22)

  • For the exam, max 1 mediator
  • Read paths \(a\), \(b\) and \(c\) from the Path coefficients table
  • Test mediation with the \(p\)-value of the indirect effect \(a \times b\)

Exam note: moderation (lecture 26)

  • Keep the default settings of each analysis, no need to center by hand
    • Process module centers for you (Mean-centered moderation)
    • Linear regression does not center
  • So \(b_1\) and \(b_2\) differ between the two analyses
    • Process gives the effect at the mean of the other predictor
    • Linear regression gives the effect when the other predictor is 0
  • The interaction \(b_3\) is the same in both
  • Check the assumptions in Linear Regression, not in the Process module

Exam note: chi-squared test (lecture 28)

  • Fisher’s exact test when an expected count is below 5 (Cells → Expected)
    • In JASP via Statistics → Odds ratio (2x2 only)
  • No Yates’s correction (χ² continuity correction)
  • Odds ratio from the observed counts
    • The question tells you which odds go on top
    • JASP gives the log odds ratio by default (Log Odds Ratio)

Next Time

  • Interim exam 3 (Thu 19 Nov)

Contact

CC BY-NC-SA 4.0